Download
1 / 18
180 likes | 504 Views
The “Smartphone App Market Monitor” is a comprehensive information source on the smartphone device and application market. In addition to Q1 market updates, Vol.6 includes a look at China’s Smartphone and App Market, including China’s App Stores landscape and Smartphone users.

E N D
Smartphone App Market Monitor Including a special section on China’ssmartphone and app market Day of update: 7th July 2012 Volume 6 Preview - read more here: http://www.research2guidance.com/shop/index.php/smartphone-app-market-monitor-pdf-a © research2guidance | July2012
SAMM Volume 6 Contents Smartphone app market monitor: Q1 2012 update • Global smartphone market (penetration, market shares and shipments) • App stores comparison (key trends and figures) • Smartphone application market currentstatus • China‘s smartphone and app market Preview - read more here: http://www.research2guidance.com/shop/index.php/smartphone-app-market-monitor-pdf-a
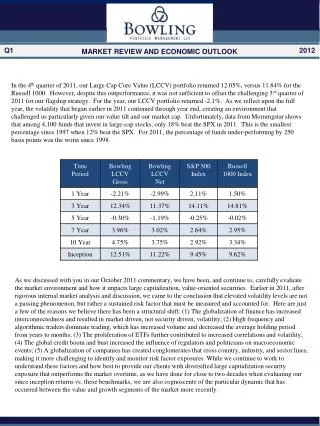
Key takeaways from Q1 2012 • xx million smartphones were shipped in Q1 2012, xx% less than in the previous quarter. • Smartphone’s share of total mobile device sales increased from xx% to xx%, resulting in xx out of every xx mobile devices shipped to be a smartphone. • Helped by the expansion of the iPhone4S into new markets and carriers, Apple’s sales grew by xx percent over the last xx months. • xxxx regained its position as the world’s number one smartphone manufacturer by selling xx million smartphones worldwide. • xx lost its position of world’s top mobile handset vendor to xx in Q1 2012. • xx finished Q1 as the absolute leader among mobile OS, accounting for xx% of all smartphone sales. • The total number of smartphone and tablet applications published in all stores reached the xx million mark during Q1, a year-over-year growth of xx%. • xx out of every xx smartphones shipped ran on xxxx, contributing to xxxx in average number of daily downloads. • Q1 total number of downloads reached xxxx billion, a year-over-year growth of xx%. • Revenue accrued from paid app downloads amounted to $xx billion, a year-over-year increase of xx%. Preview - read more here: http://www.research2guidance.com/shop/index.php/smartphone-app-market-monitor-pdf-a
Preview slides The following slides are a preview of the report. Please purchase for full content. Preview - read more here: http://www.research2guidance.com/shop/index.php/smartphone-app-market-monitor-pdf-a
The concept behind the “Smartphone App Market Monitor” • This is the sixth volume of the “Smartphone App Market Monitor”, which acts as a comprehensive source of information on the Smartphone app market. • This volume provides Q1 2012 market information as well as an in-depth look at China’s smartphone and app market. • To keep pace with the latest trends, amend and revise forecasts as well as inform readers about key topics, this report is updated and extended every quarter. • Vol. 1 of the “Smartphone App Market Monitor” featured a special interest chapter on Smartphone user demographics, app downloads and usage habits; Vol. 2 looked at the media tablets market; Vol. 3 introduced mobile retail; and, Vol. 4 overviewed the emerging mobile payments market; Volume 5 contains an extensive year-on-year (2010-2011) comparison. These special insight chapters can be acquired separately on request. • By using, comparing and evaluating different sources on the mobile market the “Smartphone App Market Monitor”, provides a range of analyses and surveys which would allow any app publisher to get a detailed view on the market and enable informed business decisions. • As the market monitor is designed to support internal discussions and business decisions, content is presented as much as possible in graphs and tables. Preview - read more here: http://www.research2guidance.com/shop/index.php/smartphone-app-market-monitor-pdf-a
Despite fall in shipments during Q1 2012, one out of every xx devices shipped were a smartphone Global smartphone market Smartphone share of global mobile device shipments (2007 Q1 – 2012 Q1)
xxxx and xxxxsmartphones accounted for more than xxxx out of every xxxxsmartphones shipped during Q1 2012 Global smartphone market Number of smartphones shipped per platform (2008 Q3 – 2012 Q1)
xxxx extended its lead over xxxx by shipping in excess of xx million devices during Q1 2012 Global smartphone market Number of smartphones shipped per platform 2008 Q4 – 2012 Q1 (in million units) Preview - read more here: http://www.research2guidance.com/shop/index.php/smartphone-app-market-monitor-pdf-a
xxxx was the only xxxx to significantly gain market share during Q1 2012 Global smartphone market Smartphone operating systems’ market share by shipments (2009 Q1 – 2012 Q1)
xxxx finished Q1 as the absolute leader among mobile OS, accounting for xx% of all smartphone sales Global smartphone market Smartphone operating systems’ market share by shipments in 2009 Q1 – 2012 Q1 Preview - read more here: http://www.research2guidance.com/shop/index.php/smartphone-app-market-monitor-pdf-a
Niche stores build up on xxxx rampant popularity: xx% of all OS-Centric stores are devoted to xxxx App stores comparison Niche app stores by type (2012 Q1) Base: 94 niche app stores.
Key facts and figures: OS & OEM Stores(1/3) App stores comparison a Store operator – Handmark b Unless signed up for an open source developer membership, which waves these submission and SDK fees c The web-version of Windows Mobile 6.x Marketplace was discontinued on July 15th, 2011. Apps still available through downloadable app store application. X $
At the end of Q1 2012, xxxx had xxxxiPhone apps and xxxxiPad native apps, and xxxx had xxxx App stores comparison Number of applications per platform (2008 Q3 – 2012 Q1) Note: Dotted line indicates total number of apps in Apple iPhoneandiPad App Stores.
Average app selling price across all stores stood at $xx in Q1, a decrease of around $xx in comparison to the previous quarter App stores comparison • Average displayed paid application price in official OEM&OS app stores (2009 Q2 – 2012 Q1) Preview - read more here: http://www.research2guidance.com/shop/index.php/smartphone-app-market-monitor-pdf-a Note: (*)Previously average price was counted on a general Top 1,000 apps. In Q3 2011 BlackBerry has separated the lists of Applications, Games and Themes, thus the price for Q3 2011 was counted taking into account only Top1000 Applications (Games and Themes excluded). Source: research2guidance, 2012.
xxxx surpassed xxxx share of total app download App stores comparison App store share of total application downloads per period (2008 – 2012 Q1) c Other Independent Stores include: Handango, Mobango, MobiHand, Handmark, Handster and other; Other OS&OEM include: Windows Market Place, Samsung Apps, Palm App Catalog, Play Now Arena, LG Application Store and other; MNO stores include: Vodafone 360, O2 Litmus Store, China Mobile Market, Verizon Media Store, Orange Application Shop, AT&T AppCenter, Sprint Digital Lounge, web2go, TelefonicamStore, SK T-store, KT Show App Store, TelstraOne Experience, Optus App Store, AirtelAppCentral and other. Source: research2guidance, 2012.
Apple App Store top 10 categories saw a year-over-year growth rate of xx% Top ten apple app store categories (Q4 2010 and Q1 2012) Apps per category Source: research2guidance, 2012.
Quarterly downloads numbers were x times greater on average in 2011 than in 2010 2010 and 2011 marketcomparison Total app downloads (2010 and 2012 quarter-by-quarter comparison) Number of downloads (in millions)
research2guidance: get in contact Reports and PowerPoint slide-sets market insights on selected topics Bespoke research custom-made research for your individual needs Knowledge center a subscription to a wealth of data, analysis, profiles, and daily news and opinion Consulting services projects tailored to assist you in developing your mobile strategy A one-on-one expert call with a research analyst for • A personal 15-30 min. consultation • Questions and answers about our research • Matching your needs with our research services Write an email to expert@research2guidance.com Direct web-shop access to our reports and PPTs • Browse our research products • Download immediately • Easy payment (VISA; Master Card; PayPal) Visit www.research2guidance.com/shop Additional information on • Pricing • Report Packages • Custom made services and bespoke projects Call+49 (0)30 609893366 Our Service Offerings Contact us for Preview - read more here: http://www.research2guidance.com/shop/index.php/smartphone-app-market-monitor-pdf-a