Download
1 / 20
200 likes | 210 Views
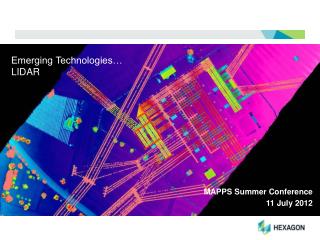
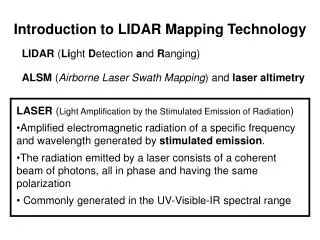
San Diego State University. LIDAR – Li ght D etection A nd R anging. 1 st , 2 nd , 3 rd , and 4 th returns have different X,Y (&Z) Results in additional LIDAR points. San Diego State University. LIDAR – Li ght D etection A nd R anging. Multiple returns

E N D
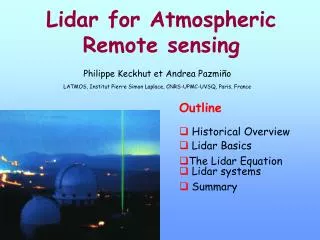
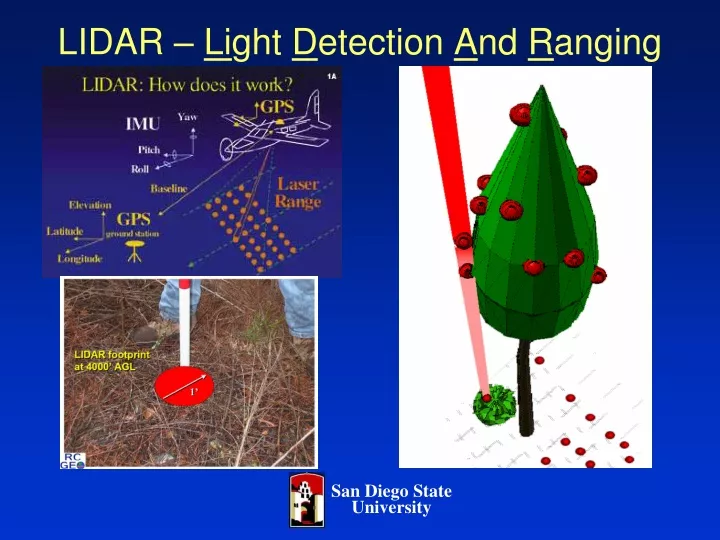
San Diego State University LIDAR – Light Detection And Ranging
1st, 2nd, 3rd, and 4th returns have different X,Y (&Z) • Results in additional LIDAR points
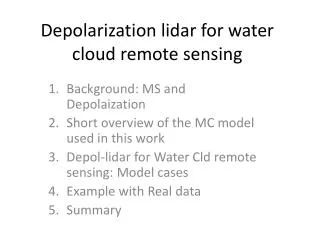
San Diego State University LIDAR – Light Detection And Ranging • Multiple returns • - Provide additional LIDAR points (X,Y,Z) • - Indicate vegetation canopy (or edge of tall feature) • - Reveal structural detail within the canopy
San Diego State University LIDAR – LIght Detection And Ranging 1st 2nd 6.5 ft 3rd 4th 1st, 2nd, 3rd, and 4th Returns Have Different X,Y (&Z)
LIDAR – Light Detection And Ranging Colored by Flight Line (single line) Colored by Elevation Colored by Return Number Colored by Classification
LIDAR – Light Detection And Ranging Colored by Flight Line (single line) Colored by Elevation Colored by Return Number Colored by Classification
LIDAR – Light Detection And Ranging Initial LIDAR Elevation Filtered LIDAR Elevation (Bare Ground) Classified LIDAR Surface (Bare Ground and Canopy) Classified LIDAR Surface (Bare Ground )
San Diego State University LIDAR – Light Detection And Ranging Border color infrared photography
San Diego State University LIDAR – Light Detection And Ranging • LIDAR point spacing is ~5-10 ft • Spacing is closer in flight line overlap areas and in areas with multiple returns
San Diego State University LIDAR – Light Detection And Ranging • Vegetation Structure • Height vs. Width • Shape
San Diego State University LIDAR – Light Detection And Ranging • Vegetation Height 20 ft
LIDAR – Light Detection And Ranging 2000 Color Infrared Image Classified LIDAR Surface (Bare Ground and Canopy) 2000 Color Infrared Image (With LIDAR “Canopy” Height) Classified LIDAR Surface (Bare Ground ) Yellow – Green = 1-40 ft Height
LIDAR – Light Detection And Ranging • Vegetation Density (% Canopy, % Not 1st Return) Dense Moderate Sparse 1st Return Points 2nd, 3rd, 4th Return Points
San Diego State University LIDAR – Light Detection And Ranging
LIDAR Rasterized Point Summary Products ADS40 Image Maximum Height
LIDAR Rasterized Point Summary Products ADS40 Image % Canopy
LIDAR Rasterized Point Summary Products ADS40 Image % Not 1st Return
LIDAR Rasterized Point Summary Products ADS40 Image Red: Maximum Height Green: % Canopy Blue: % Not 1st Return
LIDAR Intensity - Applications • GIS systems • Backdrop imagery • Verify planimetric accuracy of existing images and GIS data • Updating GIS layers • Natural resource management • Presence/absence of vegetation • Vegetation condition • Recent soil disturbance