Download
1 / 34
390 likes | 712 Views
Deep web. Jianguo Lu. What is deep web. Also called hidden / invisible web/database In contrast to surface web interconnected by hyperlinks Content is dynamically generated from a search interface by sending queries. The search interface can be HTML form Web service …

E N D
Deep web Jianguo Lu
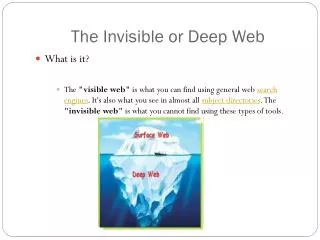
What is deep web • Also called hidden/invisible web/database • In contrast to surface web interconnected by hyperlinks • Content is dynamically generatedfroma search interface by sending queries. • The search interface can be • HTML form • Web service • … • Almost every surface web site has a companion deep web search box • E.g., Wiki, Amazon, nytimes, ibm.com… • Pictures from http://www.osti.gov/fedsearch Deep web
Deep web crawling • Crawl and index the deep web so that hidden data can be surfaced • Unlike the surface web, there are no hyperlinks to follow • Two tasks • Find deep web data sources, i.e., html forms, web services • E.g., Accessing the deep web: A survey, B He et al. CACM, 2007 • Given a data source, download the data from this data source • E.g., Google, Bing, UCLA papers.
Why deep web crawling and estimation • Most web site has a companion searchable, richer deep site • Needs to profile (#docs, #words, dist) and crawl these sites • Population size of a deep web site is an important metric for both general interests and competitive analysis • Which search engine is the largest? Lawrence and Giles, Science Apr 1998. • Which bookstore/library has most books? • Which university hosts most web pages? • How many users does facebook/twitter/weibo have? • Which newspaper has more online articles?... • Crawling • Indexing by general purpose search engines • Madhavan et al (Google) VLDB 2008 • Wu et al (Bing) ICDE 2006 • Data integration, meta crawlers, focused topic search engines, shop-bot • Business intelligence, archiving, …
Graph model of deep web • Blue dot represents a doc • Red dot represents a query • Documents can be retrieved by queries only • Both document degree and query degree follows power law • Size of blue dot is proportional to the reciprocal of its degree • Size of red dot is proportional to the sum of the size of blue dot
How difficult to download • Important to both data providers and consumers • Sub questions • Is it always possible to download all the documents? • How many queries are needed to download all the documents? • Popular queries • Rare queries • Volume of queries • Can we reduce the cost of downloading • What is the cost if we download part of the data, say 50% ? • Same as the estimation problem: given the overlapping info, we can estimate the percentage of the data downloaded, hence we can know the population size.
Q1: can we download all the documents • We can if the graph is connected • Use any graph traversal algorithm • When graph is connected? • By Erdos-Renyi random graph model, mean degree > ln(n) • May not be able to download all the docs if • There are many small documents • Use mainly rare queries • Implications (detailed experiments needed) • Easy to download large docs such as books, articles • May not be able to download all the micro-blogs, database of paper titles • What if the graph is not connected? • Hard to guess the queries in other components • The topology of the disconnected graph usually contains one large component and many small components
Disconnected graph • Document graph constructed using all the dislegomena (words occurs twice) in newsgroups20 • 20k documents • Omitted many smaller islands • Only one large component, many islands • It is a challenge to harvest all the data islands • Believed to be a universal graph topology • E.g., social networks • Semantic web?
Q2: How many queries are needed • Depends on the volume of queries • Expected volume can be calculated using Zipf’s law and Heaps’law
# queries to cover all the documents • Number of queries • increases with database size • Decrease with document size • Top and bottom queries increase in different speed • Rule of thumb • Hundreds of top queries
Q3: How to reduce the crawling cost? • Obtain documents by sending queries • Do not need to send all the queries • Goal: select the queries to • Cover all the documents • Minimize the cost • It is an optimization problem (set covering problem)
Set covering • It is NP-hard • There are many heuristic and approximation algorithms • Greedy, Lagrangian relaxation, Randomized greedy, Genetic algorithm … • None studies the dependency on data distribution • Greedy algorithm selects the next best query • Each document has the same weight • Since doc degree follows power law, document degree distribution is heavily skewed • Weighted greedy: document weight is the probability of being visited in Markov random walk • More scalable than integer programming products such as CPLEX
Set covering problem • given a universe U and a family of subsets S={S1, S2, …, Sn} of U. • a cover is a subfamily of S whose union is U. • Let J={1,2,…,n}. J* is a cover if • set covering decision problem: the input is a pair (S,U) and an integer k; the question is whether there is a set covering of size k or less. • set covering optimization problem: the input is a pair (S,U), and the task is to find a set covering which uses the fewest sets. • The decision version of set covering is NP-complete, and the optimization version of set cover is NP-hard. Set covering
Set covering example t2 t1 d1 d2 d3 t3 • Can be represented by matrix or hyper-graph. • Matrix representation • each row represents a term • each column represents a doc • If theA(i,j) is 1, • term i can retrieve document j, or • term i covers document j. Set covering
Greedy algorithm Number of new elements Set covering
Greedy algorithm is not optimal • There can be two solutions • If the first set selected is t1, then the solution is • {t1, t2} • The cost 4 • If the first selection is t2, then the solution is • {t2, t3} • the cost is 3. Set covering
Weighted greedy algorithm q1 q2 5 8 3 6 7 q4 4 9 q5 2 1 q3 Set covering
5 8 3 6 7 q4 4 9 q5 2 1 5 8 3 6 7 q4 4 9 q5 2 1 q3 One solution obtained by greedy algorithm 5 8 3 6 7 4 9 q5 2 1 Set covering Total cost is 5+4+5=14
3 6 6 7 q4 4 9 7 q4 9 2 2 1 q3 q1 5 8 3 6 4 9 2 1 q3 Solution obtained by weighted greedy algorithm q1 q2 5 8 3 6 7 q4 4 9 q5 2 1 q3 Set covering 7 Total cost is 4+5+4=13
Return limit and ranking • Newsgroups 20 • #doc=20k • 190 popular words • Df=1000~5000 • K=200, 500, ∞ Percentage can be downloaded ≈ k/min(df) Jianguo Lu, Ranking Bias in Deep Web Size Estimation Using Capture Recapture Method , Data and Knowledge Engineering, Elsevier. 69(8): 866-879 (2010).
Models of deep web • Different site requires different way of crawling and estimation • In the diagram, model in the lower layer is more difficult to crawl and estimate • Other dimensions such as • Doc extension: anchor text are indexed • Doc restriction: index first part of long text • Doc and site involve over time • Doc size and distribution • Query size and distribution • Every combination calls for its solution Random queries
Model M0r • Assumptions • Only top k documents are returned • Each document has equal probability being matched • Documents have static ranking Random queries
Estimate the size • Estimate the number of documents in a deep web • Only send queries and obtain the returns • Based on capture-recapture method developed in ecology • Documents are captured by queries
Model M0 • Assumptions • All the matched documents are returned • Each document has equal probability of being matched • Result • Jianguo Lu, Dingding Li, Estimating Deep Web Data Source Size by Capture-Recapture Method, Information Retrieval. Springer 2010. Random queries
Model M0 • The more accurate formula for the relationship between P and OR is • Conclusion: In model M0, it is not difficult to crawl a data source at all • In most cases OR will be higher than what is calculated by the above formula • Because M0 is the simplest Random queries
Model M0 vs Mh • The blue line is drawn using equation P=1-OR-2.1 • Several real data show different trend • Why? Random queries
Model Mh • Assumptions: • Each document has unequal probability of being matched by a query • All matched documents are returned • h means heterogeneity in catch probability • Originally developed in ecology, to estimate the population of wild animals • Process: capture a group of animals, mark and release them; capture another group of animals, mark and release them again; … … • Mh was first proposed in capture-recapture method Random queries • Capture frequency of news groups documents by queries • (A) is the scatter plot when documents are selected by queries. In total 13,600 documents are retrieved. • (B) is the first 100 captures in Figure (A). • (C) is the histogram of (A). • (D) is the log-log plot of (C).
The empirical result is Obtained by linear regression Model Mh Random queries
File size distributions Random queries
Measuring heterogeneity • Coefficient of Variation (CV) • Assume that the documents in the data source have different but fixed probabilities of being captured, i.e., p = {p1, p2, …,pn}, pj=1. Sampling based approach Scatter plots for various CVs. 200 random numbers within the range of 1 and 20,000 are generated in Pareto distribution.
Measuring heterogeneity CV α P Random queries Relationship between CV (γ) and α
When k and m are fixed for every query Not a practical assumption Model M0r Random queries
Model Mhr • Assumptions • Only top k documents are returned • documents have unequal probability being matched • Documents have static ranking • When k and m are fixed, we have Random queries
Evolution of the models • Comparison of models M0, Mh, M0r, and Mhr. 1000 documents are sorted according to their file size in decreasing order. 600 documents are selected in the four models, including the duplicates. k= 10;m = 20. • Subplot M0 shows that all the documents are retrieved uniformly. • Subplot Mhshows that large documents are preferred, but most of the documents can be eventually sampled. • Subplot M0r exhibits a clear cut around the 500th document. Beyond this line there are almost no documents retrieved. • Mhris the compound of M0r and Mh. Random queries