Download
1 / 23
230 likes | 233 Views
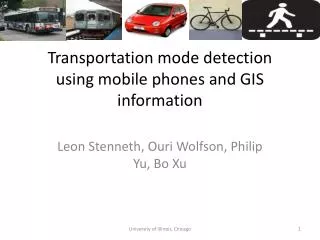
This study explores the use of smartphone sensor data for recognizing transportation modes such as car, bus, bike, run, and walk. Various machine learning techniques and feature selection methods are applied to develop accurate classifiers. The results demonstrate the potential of using smartphone sensors for transportation mode recognition.

E N D
Transportation Mode Recognition using Smartphone Sensor Data Arash Jahangiri & Hesham Rakha Presented by Hesham Rakha Samuel Reynolds Professor of Engineering, CEE Director of the Center for Sustainable Mobility, VTTI
Outline • Introduction • Literature Review • Data Collection • Methodology • Results • Conclusions VTTI | Center for Sustainable Mobility
Introduction • Objective: • Develop classifiers to identify transportation modes • Modes: • Car, Bus, Bike, Run, Walk • Methods: • Supervised machine learning techniques • Data: • Obtained from smartphone sensors • Developed a custom data acquisition system VTTI | Center for Sustainable Mobility
Introduction • Applications • Transportation Planning • Traditional Approach: Questionnaires/Travel Diaries/ Telephone Interviews • Environmental Applications • Carbon footprint / health monitoring • Safety Applications • Incorporating mode information into crash prediction models VTTI | Center for Sustainable Mobility
Literature Review • Methods Applied • Artificial Intelligence (AI) tools • Fuzzy Expert Systems, Decision Trees, Bayesian Networks, Support Vector Machine (SVM), etc. • Statistical Methods • Supporting Techniques • GIS maps • Discrete Hidden Markov Models, Bootstrap aggregating VTTI | Center for Sustainable Mobility
Literature Review VTTI | Center for Sustainable Mobility
Literature Review • Number of classes (3 - 8) • Sensor Data: Accelerometer/ GPS • GIS maps • Different motorized • Device Positioning • Window size (1 - 30 seconds) VTTI | Driving Transportation with Technology
Unique Contributions • Considered both motorized and non-motorized modes. • Did not depend on device positioning. • Did not use the information from GPS due to GPS sensor limitations. • Used data from gyroscope, accelerometer and rotation vector sensors. • Had travelers collect car and bus data on different road types with different speed limits. VTTI | Center for Sustainable Mobility
Unique Contributions • Had travelers collect data for situations similar to traffic jam conditions. • Applied all common machine learning procedures: • Complete model selection, regularization, feature selection, and feature scaling. • Created and assessed a large number of features. • Created the features based on statistical measures of dispersion as well as derivatives to incorporate feature time dependency. VTTI | Driving Transportation with Technology
Data Collection • Developed Smartphone App • Ten individuals / two different android phones • Car, bicycle, bus, walk, and run • About 25 hours of data • Sensors: Accelerometer, Gyroscope, and Rotation Vector • Preprocessing • Data Synchronization • Interpolation & resampling VTTI | Center for Sustainable Mobility
Methodology • Methods: • Support Vector Machine (SVM) • Tree-based Methods • K-Nearest Neighbor (K-NN) • Feature Selection: • Minimum Redundancy Maximum Relevance(mRMR) • Model Selection: • Five-fold Cross-Validation • Out-of-bag error for bagging and random forest methods VTTI | Center for Sustainable Mobility
Methodology – SVM • Large margin classifier • Single SVM model • Ensemble of SVM models VTTI | Center for Sustainable Mobility
Methodology – Tree based Models • Single Tree • Bagging : Ensemble of trees / all variables used in each tree • Random Forest: Ensemble of trees / restricted number of variables used in each tree • Criteria used to choose the best split at each node • Cross-Entropy. VTTI | Center for Sustainable Mobility
Methodology - KNN • Classifies test observations based on classes of the K-nearest neighbors VTTI | Center for Sustainable Mobility
Methodology – Feature Selection • Measures used to create features: VTTI | Driving Transportation with Technology
Methodology – Feature Selection • mRMR Used for feature selection • Maximize the relevance between the feature and the target class • Minimize the redundancy between that feature and the already selected features VTTI | Center for Sustainable Mobility
Results – Model Selection Number of neighbors KNN Regularization SVM Gaussian parameter SVM Number of features RF Number of trees Bag, RF VTTI | Center for Sustainable Mobility
Results - Comparison • Overall Accuracy: • Calculated by dividing the total number of correct detections by the total number of test data. • F-Score: • Combined measure of the Recall and the Precision • Youden’s index: • A measure to assess the ability of a model to avoid failure • Discriminant power: • Shows how well a model discriminates between different classes VTTI | Center for Sustainable Mobility
Results - Comparison • Overall Accuracy VTTI | Driving Transportation with Technology
Results – Feature Importance • Identified important features • Based on Mean Decrease Accuracy & Mean Decrease Gini VTTI | Center for Sustainable Mobility
Conclusions • Developed smartphone app to obtain sensor data • Used Accelerometer, Gyroscope, & Rotation Vector sensors • Transportation modes: Bike, Car, Walk, Run, and Bus • A time window of one second • Applied machine learning to develop detection models • Most difficult modes to distinguish: Car and Bus (motorized modes) • Best overall performance with Random Forest • SVM outperformed the RF in certain modes (walk and run) • Selected 80 features using mRMR, of which top 20 were identified VTTI | Center for Sustainable Mobility
Future Recommendations • Adding more data • Applying approaches to examine the data as a sequence • Considering other transportation modes (e.g. metro) • Conducting error analysis • incorporate that knowledge into the models to enhance the detection performance VTTI | Driving Transportation with Technology
Thank you! Questions/Comments ? VTTI | Driving Transportation with Technology