Download

1 / 24
280 likes | 482 Views
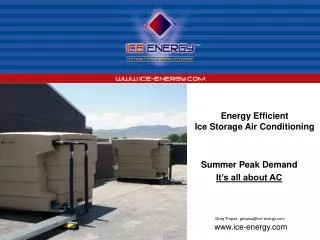
Ice Storage Air Conditioning. Building A/C is the big demand problem ~12 GW On-Peak Demand, ~10 Million installed, ~600,000 units installed annually. ~10% of building annual kW-hours, 45% of building peak demand.

E N D
Ice Storage Air Conditioning Building A/C is the big demand problem ~12 GW On-Peak Demand, ~10 Million installed, ~600,000 units installed annually ~10% of building annual kW-hours, 45% of building peak demand Source: PG&E Program Advisory Group for Energy Efficiency: HVAC PAG White Paper, Proctor Engineering
Market Transformation with Ice Storage Air Conditioning Impact on California Load Curve with 1 Million Installations Slashing A/C demand by 35%, every day Storing Wind Power Commercial Lighting Base load 6 a.m. 12 noon 6 p.m.
Ice Storage Creates a Market for Off-Peak Wind Power Typical Summer Day Wind Power Generation noon midnight. • On-Shore wind rarely blows on hot summer days • 95% is off-peak • Air conditioning load shift is a direct off-set for fossil fueled peakers • Shifts daytime fossil fuel and its emissions to nighttime wind System Demand Source: 2006 California Energy Commission report
Ice Storage Heals the Planet Peak vs. Off-peak CO2 Emission Rate* (Tons/MWh) Heavy AC Use *Southern California Edison Data • 56% lower NOx emission rate during off-peak • 40% lower CO2 greenhouse gas emissions
Widespread Applicability: All Buildings Under 3 Stories • Office • Retail • Restaurant • Residential
Air Conditioning Energy Demand Sets Market Prices Highest Cost Energy Real Time Energy Cost Conventional AC Energy Consumption
Storage Transforms the Market = True Ratepayer Relief Lowest Cost Energy Real Time Energy Cost Ice Energy AC Energy Consumption
Demand Response versus Permanent Load Reduction Demand Response A/C Cycling Significant On-Peak Cost January June December TDV = time dependent value of energy; for additional information search: TDV cookbook
Storage A/C Eliminates the On-Peak Energy Problem Insignificant On-Peak Cost January June December
Strong Alignment with Public Policy Goals • Permanently reduce peak demand 1% per year for 10 Years • Savings on energy & capacity • Savings on T&D line losses and expenditures • Savings on greenhouse gas emissions • Improve grid reliability; relieve thermal stress on distribution circuit substations, wires, and building transformers • Insulation against the impact of 1 in 10 heat driven events • Create a market for off-peak renewable wind energy • Applicable to majority of utility customer base • Local economic development
Load Impact Protocols Load Impact Resolution of Ice Storage Technology • Time – Hourly Impact Estimates. • Necessary to not only estimate hourly load reductions during system peaks, but also to measure hourly load increases during off-peak hours. • Integrates with hourly avoided cost values used in cost-effectiveness tests • Area – Climate Zone Specific Impact Estimates. • Necessary to capture the variation in load impacts created by the reduction in thermally driven air conditioning load. • Allow for the valuation of load reduction T&D benefits.
Load Impact Protocols Load Impact Measurement of Ice Energy Storage • Metering Technique (Evaluation Framework Ch 7) • Given data availability, metering of equipment demand prior to equipment installation as well as post equipment installation, can accurately estimate on-peak demand reductions and off-peak demand increases. • Impacts should be measured over a range of ambient conditions to capture the variation in impacts from temperature. • Regression analysis can be used to estimate load shifting impacts based on temperature, equipment and customer characteristics. • Engineering Simulation (Evaluation Framework Ch 6) • If no metering data are available pre installation, load can be modeled using accepted engineering simulation models such as the US Department of Energy’s DOE-2. • Billing Technique (Evaluation Framework Ch 6) • In the absence of metering data, billing data can be used in the regression analysis to model customer demand impacts from energy storage systems. • However due to the variable demand impacts of load shifting programs and the need for hourly impacts for system planning, billing data is only viable if it has hourly resolution.
Load Impact Protocols Frequency Of Impact Measurements • As a starting point page 70 of the Evaluation Framework provides suggestions for the frequency and decision criteria for the measurement of impact evaluations. • In general, technologies that provide customer control over load shifting should have ex-post program impacts measured more frequently than technologies that limit the ability or need for customer alterations of load shifting.
Cost Effectiveness Protocols Proposed Tests • Total Resource Cost (TRC) • Consistent with EE • Modify for explicit consideration of additional Demand Response benefits • Non-Participant Test • Used in lieu of TRC if gross measure costs are not available. • Participant Test • Could be used to determine likely adoption rates, but not required. • As a general policy issue, customer time-of-use retail rates should be aligned with utility procurement costs. This will allow for participant recognition of the value of demand response and load shifting programs.
Cost Effectiveness Protocols Demand Response Program Benefits • Benefit calculations in the cost-effectiveness tests should be area- and time-specific to provide the most accuracy and align with stated load impact resolution. • Benefits should include: • Energy Value • Capacity Value • T&D Value • Environmental Value • Reliability Value • Market Multiplier • Losses • RPS Compliance Cost • Real Option Value • Risk Management • Evaluations should consider persistent lifecycle savings of a program
Cost Effectiveness Protocols Benefit Values • Energy Value • Should have hourly and area resolution similar Title-24 TDV and CPUC EE values. • Expected values are adequate for PLS, but can be based on option value for dispatchable programs • Capacity Value • Can be based on capacity market prices when they are formed, or residual capacity values in the interim. • Should be evaluated in probabilistic terms. • Transmission and Distribution Value • Recognizes variation in local load pockets and capacity constraints. Would provide higher value to DR programs implemented in capacity constrained areas.
Cost Effectiveness Protocols Benefit Values • Environmental Value • Should consider all pollutants valued in energy efficiency avoided environmental costs including CO2, NOx, and PM10. • Should also vary by time period to reflect differences in emissions from marginal generation sources during different hours of the day. • Reliability Value • Additional benefits from DR program’s ability to avoid forced outages. • Value based on customer outage costs. • Inclusion of reliability value necessarily requires the consideration of the partial outage cost of participants. • Also, the same kW cannot provide both capacity and reliability value. • Market Multiplier Effect • Recognizes DR’s ability to reduce demand causing reduced market power, and reduced shortage price mark-up, which leads to lower market clearing prices for all consumers.
Cost Effectiveness Protocols Benefit Values • Losses • Accounts for avoided line losses from the transmission and distribution of electricity. As an example with 10% line losses, a MW of demand reduction is worth 1.11 MW of generation needed to deliver 1 MW to the consumer. • Renewable Portfolio Standard (RPS) Compliance Cost • Load Shifting Programs in particular shift load from peak hours where the typical generation is non-RPS compliant to off peak hours when wind generation is available. This will contribute to utility compliance with RPS requirements, and potentially avoid utility procurement of more expensive renewable energy.
Cost Effectiveness Protocols Benefit Values • Real Option Value • Demand Response programs are scalable and generally have short implementation times relative to new generation sources. • Short lead times allow utilities to wait for longer for unfolding system needs relative to new generation and thus provides a real option value from DR programs • Short commitment lengths can provide additional value by limiting the payout commitments by utilities. • Risk Management • To the extent DR provides capacity at lower risk than generation resources it will have additional value in the trade-off between utility procurement costs and risk. • See the CEC’s recent workshop on portfolio theory as it applies to utility cost expectation and risk.
Cost Effectiveness Protocols • To recap… • Use TRC test or non-participant test • Modify the tests to include additional benefits, including T&D where applicable. • Use probabilistic estimates of capacity savings that fully consider DR operating patterns and constraints • Consider persistent lifecycle benefits in program valuation • Focus on the kW capability, not the DR categories
Thank-You Gregory Tropsa, President 970-222-2987 gtropsa@ice-energy.com www.ice-energy.com Brian Horii Energy and Environmental Economics, Inc 415-391-5100 brian@ethree.com