Download
1 / 26
260 likes | 329 Views
Explore the benefits and challenges of benefit transfer techniques in valuing rivers and wetlands with meta-analysis methods. Understand the key mechanisms and approaches used in transferring values across different policy sites.

E N D
Valuing rivers and wetlands: A meta analysis of CM values Roy Brouwer and John Rolfe
Outline of this talk • Benefits transfer & meta-analysis • Database • Statistical results
Benefit transfer • The transfer of values from one case study to another policy situation • Attractive because of cost and time advantages over the separate conduct of non-market valuation experiments • Can be complex because source and target sites may not be identical • Benefit transfer may involve some adjustment of values • BT may be associated with increased uncertainty about values
Three main approaches to BT • ‘The Prospector’ – searches for suitable previous studies and transfers results across to target site • ‘The Systematic’ – designs a database of values suitable for benefit transfer • ‘The Bayesian’ – combines both a review of previous studies with potential data gathering
How a benefit transfer function works Survey site: Values = αs + βs1Xs1+ βs2Xs2 Policy site:Valuep = αs + βs1Xp1+ βs2Xp2 X1 : site and good characteristics X2 :population characteristics 5
Key mechanisms for benefit transfer • Point – total value • Total value from a previous study • Point – marginal value • Value per unit transferred • Benefit function transfer • Function allows adjustments for site and population differences • Integrations across multiple studies • Meta analysis • Bayesian methods
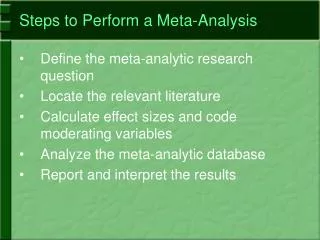
Meta analysis • Meta-analysis for use in benefit transfer involves the summarizing of results for several existing source studies in a regression function, • This function is then used to predict value estimates for a target site • Often difficult to do in practice because of methodological and framing differences between studies
Meta-analysis Survey sites:Values = αs + βs1Xs1+ βs2Xs2+ βs3Xs3 Policy sites:Valuep = αs + βs1Xp1+ βs2Xp2+ βs3Xp3 X1 : site and good characteristics X2 :population characteristics X3 :study characteristics 9
Meta-analysis • Statistical analysis of the summary findings of empirical studies • Helpful tool to summarize and explain differences in outcomes • Advantages: • transparant structure to understand underlying patterns of assumptions, relations and causalities • avoids selective inclusion of studies and weighting of findings 10
Main objective of this study Meta-analysis of Australian water valuation studies Different studies, different values Policy need for more structured overview of existing values and their usefulness in policy analysis Comparability of results and insight in transfer errors 11
When to apply Benefits Transfer? • = When to apply monetary economic valuation? • Never as good as original valuation study! • Consider a priori what is acceptable transfer error • Use meta-analysis if possible • Build databases (EVRI) • Strict reporting requirements (wider applicability of results) more emphasis on meaning, interpretability and potential use of results in different policy contexts • Often BT remains matter of expert judgement 12
Overview (1) 8 discrete choice studies related to rivers in Australia Blamey, R., Gordon, J., Chapman, R. (1999). Choice modelling: assessing the environmental values of water supply options. AJARE, 43(3): 337-357. Rolfe, J., Loch, A., Bennett, J. (2002). Tests of benefits transfer across sites and population in the Fitzroy basin. Valuing floodplain development in the Fitzroy basin Research Report no.4. Windle, J. and Rolfe, J. (2004). Assessing values for estuary protection with choice modelling using different payment mechanisms. Valuing floodplain development in the Fitzroy basin Research Report no.10. Van Bueren, M. and Bennett, J. (2004). Towards the development of a transferable set of value estimates for environmental attributes. AJARE, 48(1): 1-32. Morrison, M. and Benett, J. (2004). Valuing New South Wales rivers for use in benefits transfer. AJARE, 48(4): 591-611. Rolfe, J. and Windle, J. (2005). Valuing options for reserve water in the Fitzroy basin. AJARE, 49: 91-114. Windle, J. and Rolfe, J. (2006). Non market values for improved NRM outcomes in Queensland. Research report 2 in the non-market valuation component of AGSIP project # 13. Kragt, M., Bennett, J., Lloyd, C., Dumsday. R. (2007). Comparing choice models of river health improvement for the Goulburn River. Paper presented at 51st AARES conference. 13
Overview (2) 4 journal papers (AJARE) 3 research reports 1 conference paper WTP for improvement in river flows, waterway restoration, healthy rivers, water dependent wildlife, water quality (recreational use) 93 observations in total (implicit prices) 12 observations per study on average Range of observations per study: 1-36 Author bias: Bennett & Rolfe both in 4 studies 14
Time coverage : 1997-2006 Spatial coverage: see Fig 15
Overview (3) 16
Overview (4) 17
Overview (5) 18
Influences on the precision of implicit prices • Variation coefficients calculated from confidence intervals and cross tabulated with study characteristics • Mann-Whitney tests used to calculate differences • No difference between annual and regular payments • Sample size correlated with precision • Sample of less than 200 generate low levels of precision • Mail more precise than drop-off&collect • Nested logit more precise than conditional logit
Multivariate analysis • Responses combined in a random effects Tobit regression model • Random effects captures heteroscedasticity • Implicit prices regressed against a number of potential explanatory factors
Significant design effects • Year of study • Sample size • Mail survey • Number of choice sets • Payment vehicle • Accuracy
Challenges Low number of observations Wide variety of attributes Different measurement units (some imprecise) Small number of people doing the research >> researcher bias (advantage: easy to contact) Meaningfulness of attributes to policy & lay public? 26