Download
1 / 42
420 likes | 571 Views
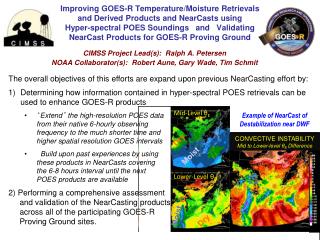
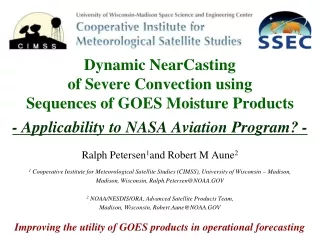
NearCasting Severe Convection using Objective Techniques that Optimize the Impact of Sequences of GOES Moisture Products. Ralph Petersen 1 and Robert M Aune 2

E N D
NearCasting Severe Convectionusing Objective Techniques thatOptimize the Impact of Sequences of GOES Moisture Products Ralph Petersen1and Robert M Aune2 1 Cooperative Institute for Meteorological Satellite Studies (CIMSS), University of Wisconsin – Madison, Madison, Wisconsin, Ralph.Petersen@NOAA.GOV 2 NOAA/NESDIS/ORA, Advanced Satellite Products Team, Madison, Wisconsin, Robert.Aune@NOAA.GOV Improving the utility of GOES products in operational forecasting
What are we trying to improve? What are we trying to correct? • - Poor precipitation forecast accuracy in short-range NWP • - Lack of satellite moisture data over land in NWP • - Time delay in getting NWP guidance to forecasters • Dominance of parameterizations over observations • in increasingly complex short-range NWP • Excessive smoothing of mesoscale moisture patterns • in NWP data assimilation • Smoothing of upper-level dynamics and dryness • Lack of objective tools for use by forecasters • in detecting pre-convective environments 1-6 hours in the future Short-range forecasts of timing and locations of severe thunderstorms - especially hard-to-forecast, isolated summer-time convection
Basic premises - NearCasting Models Should: Update/Enhance NWP guidance: Be Fast (valid 0-6 hrs in advance) Be run frequently Can avoid ‘computational stability’ issues of longer-range NWP Use all available data quickly: “Draw closely” to good data Avoid ‘analysis smoothing’ issues of longer-range NWP Be used to anticipate rapidly developing weather events: “Perishable” guidance products – need rapid delivery Avoid ‘computational resources’ issues of longer-range NWP Run Locally? – Few resources needed beyond comms, users easily trained Focus on the “pre-storm environment” - Increase Lead Time / Probability Of Detection (POD) and Reduce False Alarm Rate (FAR) Fill the Gap 0 1 5 6 hours Goals: - Increase the length of time that forecasters can make good use of quality observations which can supplement NWP guidance for their short range forecasts - Provide objective tools to help them do this
A Specific Objective: Extend the benefits of GOES Sounder Derived Product Images (DPI) Moisture Data to forecasters To increase usefulness, GOES Sounder products are available to forecasters as images Products currently available include: - Total column Precipitable Water (TPW) - 3-layers Precipitable Water (PW) - Stability Indices, . . . DPI Strengths and Current Limitations + Image Displays speed comprehension of information in GOES soundings, and + Data Improve upon Model First Guess, but - - - - Products used only as observations, and - Currently have no predictive component - Data not used in current NWP models GOES 900-700 hPa PW - 20 July 2005
0700 UTC Lower-tropospheric GOES Sounder Derived Product Imagery (DPI) 3 layers of Precipitable Water Sfc-900 hPa 900-700 hPa 700-300 hPa 1000 UTC Forecasters need tools that: Preserve high-resolution data and Show the future state of the atmosphere 1300 UTC And, after initial storms have developed, cirrus blow-off can mask lower-level moisture maximum in subsequent DPI satellite products Small cumulus developing in boundary layer later in day can also mask retrievals 1800 UTC GOES 900-700 hPa Precipitable Water - 20 July 2005
What are the benefits of a Lagrangian NearCasting approach? Extending a proven diagnostic approach to prediction - Quick (10-25 minute time steps) and minimal resources needed - Can be used ‘stand-alone’ or to ‘update’ other NWP guidance DATA DRIVEN - Data used (and combined) directly - no ‘analysis smoothing’ – Retains observed maxima and minima and extreme gradients - Spatial resolution adjusts to available data density - GOES products can be projected forward at full resolution - even as they move into areas where clouds form and subsequent IR observations are no longer available - Data can be tracked (aged) through multiple observation times - New data are added at time observed – not binned / averaged - Use best aspects of all available data sets e.g., Cloud Drift winds can be combined with surface obs cloud heights to create a ‘partly cloudy’ parcel with good height and good motion e.g., Wind Profiler data can be projected forward and include accelerations
Lagrangian NearCast Dry Moist How it works: Instead of interpolating randomly spaced moisture observations to a fixed grid (and smooth data) and then using gridded wind data to determine changes of to calculating moisture changes at the fixed grid points, the Lagrangian approach interpolated wind data to each of the moisture obs 13 April 2006 – 2100 UTC 900-700 hPa GOES PW 0 Hour NearCast
Lagrangian NearCast How it works: Instead of interpolating randomly spaced moisture observations to a fixed grid (and smoothes data) and then using gridded wind data to determine changes of to calculating moisture changes at the fixed grid points, the Lagrangian approach interpolated wind data to each of the moisture obs and then moves the 10 km data to new locations, using dynamically changing wind forecasts with ‘long’ (10-15 minute) time steps . 13 April 2006 – 2100 UTC 900-700 hPa GOES PW 0 Hour Ob Locations
Lagrangian NearCast How it works: Instead of interpolating randomly spaced moisture observations to a fixed grid (and smoothes data) and then using gridded wind data to determine changes of to calculating moisture changes at the fixed grid points, the Lagrangian approach interpolated wind data to each of the moisture obs and then moves the 10 km data to new locations, using dynamically changing wind forecasts with ‘long’ (10-15 minute) time steps . 13 April 2006 – 2100 UTC 900-700 hPa GOES PW 1 Hour NearCast Obs
Lagrangian NearCast How it works: Instead of interpolating randomly spaced moisture observations to a fixed grid (and smoothes data) and then using gridded wind data to determine changes of to calculating moisture changes at the fixed grid points, the Lagrangian approach interpolated wind data to each of the moisture obs and then moves the 10 km data to new locations, using dynamically changing wind forecasts with ‘long’ (10-15 minute) time steps . 13 April 2006 – 2100 UTC 900-700 hPa GOES PW 2 Hour NearCast Obs
Lagrangian NearCast How it works: Instead of interpolating randomly spaced moisture observations to a fixed grid (and smoothes data) and then using gridded wind data to determine changes of to calculating moisture changes at the fixed grid points, the Lagrangian approach interpolated wind data to each of the moisture obs and then moves the 10 km data to new locations, using dynamically changing wind forecasts with ‘long’ (10-15 minute) time steps . 13 April 2006 – 2100 UTC 900-700 hPa GOES PW 3 Hour NearCast Obs
Lagrangian NearCast Dry Moist How it works: Instead of interpolating randomly spaced moisture observations to a fixed grid (and smoothes data) and then using gridded wind data to determine changes of to calculating moisture changes at the fixed grid points, the Lagrangian approach interpolated wind data to each of the moisture obs and then moves the 10 km data to new locations, using dynamically changing wind forecasts with ‘long’ (10 minute) time steps . The moved moisture ‘obs’ values are then periodically transferred back to an ‘image’ grid, but only for display. 13 April 2006 – 2100 UTC 900-700 hPa GOES PW 3 Hour NearCast Image 10 km data, 10 minute time steps
Observation: A preferred location for rapid development of convection is under and along edges of mid-level dry bands as they move over localized low-level moisture maxima
Determining if the atmosphere is conducive to convective storms STABLE Vertical Temperature Structure shows warm air over colder air WHY? Before we go farther, A Quick Tutorial • 3 2 1 0 • Elevation (km) If parcels are lifted from either the top or bottom of the inversion layer, they both become cooler than surroundings and sink -20 -10 0 10 20 30 Temperature (C)
Determining if the atmosphere is conducive to convective storms But if sufficient moisture is added to bottom of an otherwise stable layer and the entire layer is lifted, it can become Absolutely Unstable. Latent heat added • 3 2 1 0 • Elevation (km) Dry When the entire layer is lifted with moist bottom and top dry, the inversion bottom cools less than top and it becomes absolutely unstable – producing auto-convection Moist -20 -10 0 10 20 30 Temperature (C)
Determining if the atmosphere is conducive to convective storms Lifted layer can become Absolutely Unstable. This will cause the layer to overturn and the moist air will raise very rapidly Requires sequence of low-level moistening, mid/upper-level drying and descent (needed to trap lower-level moisture and prevent convection from occurring too quickly) - followed by decreased convergence aloft. • 3 2 1 0 • Elevation (km) Dry When the entire layer is lifted with moist bottom and top dry, the inversion bottom cools less than top and it becomes absolutely unstable – producing auto-convection Moist -20 -10 0 10 20 30 Temperature (C) So, we really need to monitor not onlythe increase of low level moisture, but ,more importantly, to identify areas where Low-level Moistening and Upper-level Dryingwill occur simultaneously
A case study was conducted for the hail storm event of 13 April 2006 that caused major property damage across southern Wisconsin The important questions are both where and when severe convection will occur, and Where convection will NOT occur? 24 Hr Precip 10 cm Hail NWP models placed precipitation too far south and west - in area of large-scale moisture convergence
A case study was conducted for the hail storm event of 13 April 2006 that caused major property damage across southern Wisconsin The important questions are both where and when severe convection will occur, and Where convection will NOT occur?
Initial Conditions 0 Hour Moisture for 2100UTC From 13 April 2006 2100UTC GOES Derived Product Images 900-700 hPa PW 700-300 PW Initial GOES DPIs Valid 2100 UTC 2115 UTC Sat Imagery 13 April 2006 – 2100 UTC 700-300 hPa GOES PW 0 Hour NearCast 13 April 2006 – 2100 UTC 900-700 hPa GOES PW 0 Hour NearCast
Initial Conditions 0 Hour Moisture for 2100UTC From 13 April 2006 2100UTC GOES Derived Product Images 900-700 hPa PW 700-300 PW Initial GOES DPIs Valid 2100 UTC 2115 UTC Sat Imagery NAM 03h Forecast of 700-300 hPa and 900-700 hPa PW valid 2100 UTC Comparison with NWP conditions 13 April 2006 – 2100 UTC 700-300 hPa GOES PW 0 Hour NearCast 13 April 2006 – 2100 UTC 900-700 hPa GOES PW 0 Hour NearCast
NearCasts 0 Hour Projection for 2100UTC From 13 April 2006 2100UTC GOES Derived Product Images 900-700 hPa PW 700-300 PW 0 hr Lagrangian NearCasts of GOES DPIs Valid 2100 UTC 2115 UTC Sat Imagery Low-Level Moistening Low-Level Moistening 13 April 2006 – 2100 UTC 700-300 hPa GOES PW 0 Hour NearCast 13 April 2006 – 2100 UTC 900-700 hPa GOES PW 0 Hour NearCast
NearCasts 2 Hour Projection for 2300UTC From 13 April 2006 2100UTC GOES Derived Product Images 900-700 hPa PW 700-300 PW 2 hr Lagrangian NearCasts of GOES DPIs Valid 2300 UTC 2315 UTC Sat Imagery Low-Level Moistening 13 April 2006 – 2100 UTC 700-300 hPa GOES PW 2 Hour NearCast 13 April 2006 – 2100 UTC 900-700 hPa GOES PW 2 Hour NearCast
NearCasts 4 Hour Projection for 0100UTC From 13 April 2006 2100UTC GOES Derived Product Images 900-700 hPa PW 700-300 PW 4 hr Lagrangian NearCasts of GOES DPIs Valid 0100 UTC 0115 UTC Sat Imagery Low-Level Moistening 13 April 2006 – 2100 UTC 700-300 hPa GOES PW 4 Hour NearCast 13 April 2006 – 2100 UTC 900-700 hPa GOES PW 4 Hour NearCast
NearCasts 6Hour Projection for 0300UTC From 13 April 2006 2100UTC GOES Derived Product Images 900-700 hPa PW 700-300 PW 6 hr Lagrangian NearCasts of GOES DPIs Valid 0300 UTC 0315 UTC Sat Imagery Low-Level Moistening 13 April 2006 – 2100 UTC 700-300 hPa GOES PW 6 Hour NearCast 13 April 2006 – 2100 UTC 900-700 hPa GOES PW 6 Hour NearCast
NearCasts 0 Hour Projection for 2100UTC From 13 April 2006 2100UTC GOES Derived Product Images 900-700 hPa PW 700-300 PW 0 hr Lagrangian NearCasts of GOES DPIs Valid 2100 UTC 2115 UTC Sat Imagery Mid-Level Drying Mid-Level Drying 13 April 2006 – 2100 UTC 700-300 hPa GOES PW 0 Hour NearCast 13 April 2006 – 2100 UTC 900-700 hPa GOES PW 0 Hour NearCast
NearCasts 2 Hour Projection for 2300UTC From 13 April 2006 2100UTC GOES Derived Product Images 900-700 hPa PW 700-300 PW 2 hr Lagrangian NearCasts of GOES DPIs Valid 2300 UTC 2315 UTC Sat Imagery Mid-Level Drying 13 April 2006 – 2100 UTC 700-300 hPa GOES PW 2 Hour NearCast 13 April 2006 – 2100 UTC 900-700 hPa GOES PW 2 Hour NearCast
NearCasts 4 Hour Projection for 0100UTC From 13 April 2006 2100UTC GOES Derived Product Images 900-700 hPa PW 700-300 PW 4 hr Lagrangian NearCasts of GOES DPIs Valid 0100 UTC 0115 UTC Sat Imagery Mid-Level Drying 13 April 2006 – 2100 UTC 700-300 hPa GOES PW 4 Hour NearCast 13 April 2006 – 2100 UTC 900-700 hPa GOES PW 4 Hour NearCast
NearCasts 6Hour Projection for 0300UTC From 13 April 2006 2100UTC GOES Derived Product Images 900-700 hPa PW 700-300 PW 6 hr Lagrangian NearCasts of GOES DPIs Valid 0300 UTC 0315 UTC Sat Imagery Mid-Level Drying 13 April 2006 – 2100 UTC 700-300 hPa GOES PW 6 Hour NearCast 13 April 2006 – 2100 UTC 900-700 hPa GOES PW 6 Hour NearCast
It this real ? NearCasts 0 Hour Projection for 2100UTC From 13 April 2006 2100UTC GOES Derived Product Images 900-700 hPa PW 700-300 PW Validation of rapid moisture change in NE Iowa using GPS TPW data 0 hr Lagrangian NearCasts of GOES DPIs Valid 2100 UTC 2115 UTC Sat Imagery GOES Observed 900-300 PW = 18+6 = 24 GPS TPW = 25 Mid-Level Drying Mid-Level Drying Validation of Local NE Iowa moisture maximum with GPS TPW data 13 April 2006 – 2100 UTC 700-300 hPa GOES PW 0 Hour NearCast 13 April 2006 – 2100 UTC 900-700 hPa GOES PW 0 Hour NearCast
It this real ? NearCasts 2 Hour Projection for 2300UTC From 13 April 2006 2100UTC GOES Derived Product Images 900-700 hPa PW 700-300 PW Validation of rapid moisture change in NE Iowa using GPS TPW data 2 hr Lagrangian NearCasts of GOES DPIs Valid 2300 UTC 2315 UTC Sat Imagery GOES Observed 900-300 PW = 20+5 = 25 GPS TPW= 28 Mid-Level Drying Validation of Local NE Iowa moisture maximum with GPS TPW data 13 April 2006 – 2100 UTC 700-300 hPa GOES PW 2 Hour NearCast 13 April 2006 – 2100 UTC 900-700 hPa GOES PW 2 Hour NearCast
It this real ? NearCasts 4 Hour Projection for 0100UTC From 13 April 2006 2100UTC GOES Derived Product Images 900-700 hPa PW 700-300 PW Validation of rapid moisture change in NE Iowa using GPS TPW data 4 hr Lagrangian NearCasts of GOES DPIs Valid 0100 UTC 0115 UTC Sat Imagery GOES Observed 900-300 PW = 22+4 = 26 GPS TPW= 30 Mid-Level Drying Validation of Local NE Iowa moisture maximum with GPS TPW data 13 April 2006 – 2100 UTC 700-300 hPa GOES PW 4 Hour NearCast 13 April 2006 – 2100 UTC 900-700 hPa GOES PW 4 Hour NearCast
It this real ? NearCasts 6Hour Projection for 0300UTC From 13 April 2006 2100UTC GOES Derived Product Images 900-700 hPa PW 700-300 PW Validation of rapid moisture change in NE Iowa using GPS TPW data 6 hr Lagrangian NearCasts of GOES DPIs Valid 0300 UTC 0315 UTC Sat Imagery GOES NearCast 900-300 PW = 10 + 3 = 13 GPS TPW = 16 13 Mid-Level Drying Validation of Local NE Iowa moisture maximum with GPS TPW data 13 April 2006 – 2100 UTC 700-300 hPa GOES PW 6 Hour NearCast 13 April 2006 – 2100 UTC 900-700 hPa GOES PW 6 Hour NearCast
Vertical Moisture Gradient (900-700 hPa GOES PW - 700-500 hPa GOES PW) 0 Hour NearCast for 2100UTC From 13 April 2006 2100UTC Formation of Convective Instability 0 hr Lagrangian NearCasts of GOES DPIs Valid 2100 UTC 2115 UTC Sat Imagery Differential Moisture Transport Creates Convective Instability Differential Moisture Transport Creates Vertical Moisture Gradients 13 April 2006 – 2100 UTC 700-300 hPa GOES PW 0 Hour NearCast 13 April 2006 – 2100 UTC 900-700 hPa GOES PW 0 Hour NearCast
Vertical Moisture Gradient (900-700 hPa GOES PW - 700-500 hPa GOES PW) 2 Hour NearCast for 2300UTC From 13 April 2006 2100UTC Formation of Convective Instability 2 hr Lagrangian NearCasts of GOES DPIs Valid 2100 UTC 2315 UTC Sat Imagery Differential Moisture Transport Creates Vertical Moisture Gradients 13 April 2006 – 2100 UTC 700-300 hPa GOES PW 2 Hour NearCast 13 April 2006 – 2100 UTC 900-700 hPa GOES PW 2 Hour NearCast
Vertical Moisture Gradient (900-700 hPa GOES PW - 700-500 hPa GOES PW) 4 Hour NearCast for 0100UTC From 13 April 2006 2100UTC Formation of Convective Instability 4 hr Lagrangian NearCasts of GOES DPIs Valid 2100 UTC 0115 UTC Sat Imagery Differential Moisture Transport Creates Vertical Moisture Gradients 13 April 2006 – 2100 UTC 700-300 hPa GOES PW 4 Hour NearCast 13 April 2006 – 2100 UTC 900-700 hPa GOES PW 4 Hour NearCast
Vertical Moisture Gradient (900-700 hPa GOES PW - 700-500 hPa GOES PW) 6 Hour NearCast for 0300UTC From 13 April 2006 2100UTC Formation of Convective Instability 6 hr Lagrangian NearCasts of GOES DPIs Valid 2100 UTC 0315 UTC Sat Imagery 0315 UTC Sat Imagery Differential Moisture Transport Creates Vertical Moisture Gradients 13 April 2006 – 2100 UTC 700-300 hPa GOES PW 6 Hour NearCast 13 April 2006 – 2100 UTC 900-700 hPa GOES PW 6 Hour NearCast
Examples like this show that: • - The GOES DPI moisture products provide good data • - The Lagrangian NearCasts produce useful and frequently updates about the FUTURE stability of the atmosphere • - - - - - - - - - - - - - - - - - - - - - - - - - - - - - - - - - - - - - - - - - - - - - - - - - • A number of additional modifications have been made to • the image products more useful in operations: • Eliminate displays in areas without NearCast ‘data’ • “Look” more like satellite observations • Add uncertainty into longer NearCast images by increasing smoothing through NearCast period • Also: • Want to show the impact of frequent data updates available only from geostationary systems Initial Conditions 0 Hour Moisture for 2100UTC From 13 April 2006 2100UTC GOES Derived Product Images 900-700 hPa PW 700-300 PW Initial GOES DPIs Valid 2100 UTC 2115 UTC Sat Imagery 13 April 2006 – 2100 UTC 700-300 hPa GOES PW 0 Hour NearCast 13 April 2006 – 2100 UTC 900-700 hPa GOES PW 0 Hour NearCast
Run Time > 18 UTC 19 UTC 20 UTC 21 UTC Convectively Stable Valid 18UTC 19UTC 20 UTC 21 UTC 22 UTC 23 UTC 00 UTC 01 UTC 02 UTC 03 UTC Derived Vertical Moisture Difference Gray areas indicate regions without trajectory data from last 6 hours of NearCasts No Data 19Z New Data 20Z New Data 21Z New Data Convectively Unstable Verifying Radar Areal influence of each predicted trajectory point expands with NearCast length (Longer-range NearCasts have more uncertainly and should therefore show less detail)
Run Time > 20 UTC 21 UTC 22 UTC 23 UTC Convectively Stable Valid 20 UTC 21 UTC 22 UTC 23 UTC 00 UTC 01 UTC 02 UTC 03 UTC 04 UTC 05 UTC Derived Vertical Moisture Difference No Data 21Z New Data 22Z New Data 23Z New Data Convectively Unstable Verifying Radar RUC 6 hr Cloud Top Forecast Valid 03 UTC Repeated insertion of hourly GOES data improves and revalidates NearCasts
Summary – An Objective Lagrangian NearCasting Model - Quick and minimal resources needed - Can be used ‘stand-alone’ or to ‘update’ other NWP guidance DATA DRIVEN at the MESOSCALE - Data can be inserted (combined) directly retaining resolution and extremes - NearCasts retain useful maxima and minima – image cycling preserves old data Forecast Images agree with storm formations and provide accurate/timely guidance • Goals met: • Provides objective tool to increase the length of time that forecasters can make good use of detailed GOES moisture data in their short range forecasts (augment smoother NWP output) • Expands value of GOES • moisture products from observations to short-range forecasting tools • Testing planned in NWS offices Stable Unstable Differential Moisture Transport Creates Convective Instability Dry Moist
Examples like this show that: • - The GOES DPI moisture products provide good data • - The Lagrangian NearCasts produce useful and frequently updates about the FUTURE stability of the atmosphere • - - - - - - - - - - - - - - - - - - - - - - - - - - - - - - - - - - - - - - - - - - - - - - - - - • Next steps: • 24/7 runs • Need WFO evaluation: • Is this a useful forecasting tool?( If so, when and when not? ) • What additional tuning is needed? • What other parameters should be included (LI, CAPE, . . .) • How should it be tested? ( Web-based initially and/or directly to AWIPS? ) • Let’s talk more Initial Conditions 0 Hour Moisture for 2100UTC From 13 April 2006 2100UTC GOES Derived Product Images 900-700 hPa PW 700-300 PW Initial GOES DPIs Valid 2100 UTC 2115 UTC Sat Imagery 13 April 2006 – 2100 UTC 700-300 hPa GOES PW 0 Hour NearCast 13 April 2006 – 2100 UTC 900-700 hPa GOES PW 0 Hour NearCast
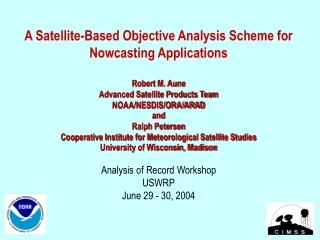
Why we need GOES (not just POES) data for detecting small-scale convection, An unforecasted mesoscale Derecho which initially moved from MN across south-central WI, decayed and then re-intensified south of Chicago Comparison of GOES (left) and AIRS (right) data coverage around 0700 UTC 20 July 2006. Times and lateral limits of AIRS overpasses shown. For GOES: Details of moisture maximum (warm colors) which was initially over Iowa and subsequently moved eastward to support convection over WI and IL are clearly identified in spatially continuous data. For POES: No AIRS data were available over IA (indicated by white areas), due to combination of: 1) cloud obscurations (e.g., over MN and western IA in later 0900 UTC data), and 2) data gaps between successive orbital paths (e.g., central and eastern IA). Note: Neither radiosonde nor aircraft moisture data would have been available around 0700 UTC for this area.