Download
1 / 29
290 likes | 456 Views
High-Power Stabilized Lasers and Optics of GW Detectors. Rick Savage LIGO Hanford Observatory. Overview. In general, issues and hardware solutions from a LIGO perspective because of familiarity.

E N D
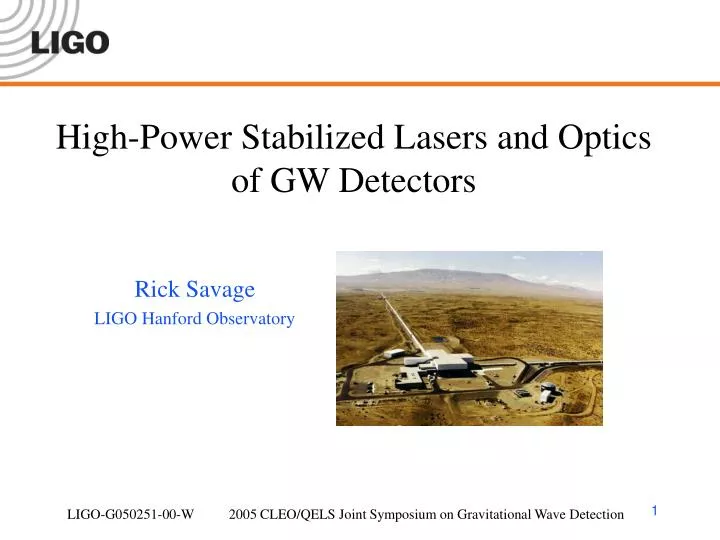
High-Power Stabilized Lasers and Optics of GW Detectors Rick Savage LIGO Hanford Observatory
Overview • In general, issues and hardware solutions from a LIGO perspective because of familiarity. • Other GW interferometers (GEO, LCGT, TAMA, Virgo) face similar issues and have developed their own solutions • Lasers • Initial LIGO - ~10 watts • Requirements, performance • Advanced LIGO ~ 200 watts • Concept, status • Optics • Initial and advanced LIGO core optics – test masses • Requirements, performance • Excess absorption in H1 interferometer optics • Efforts to identify absorption site
Power Recycled Michelson Interferometer with Fabry-Perot Arm Cavities end test mass 4 km (2 km) Fabry-Perotarm cavity recycling mirror input test mass Laser beam splitter signal GW detector – laser and optics
Pre-Stabilized Laser System • Laser source • Frequencypre-stabilizationand actuator forfurther stab. • Compensation for Earth tides • Power stab. inGW band • Power stab. at modulation freq.(~ 25 MHz)
Initial LIGO 10-W laser • Master Oscillator Power Amplifier configuration (vs. injection-locked oscillator) • Lightwave Model 126 non-planar ring oscillator (Innolight) • Double-pass, four-stage amplifier • Four rods - 160 watts of laser diode pump power • 10 watts in TEM00 mode
Running continuously since Dec. 1998 on Hanford 2k interferometer Maximum output power has dropped to ~ 6 watts Replacement of amplifier pump diode bars had restored performance in other units Servo systems maintain lock indefinitely (weeks - months) LIGO I PSL performance
Frequency stabilization • Three nested control loops • 20-cm fixed reference cavity • 12-m suspended modecleaner • 4-km suspended arm cavity • Ultimate goal: Df/f ~ 3 x 10-22
Power stabilization • In-band (40 Hz – 7 kHz) RIN • Sensors located before and after suspended modecleaner • Current shunt actuator - amp. pump diode current • RIN at 25 MHz mod. freq. • Passive filtering in 3-mirror triangular ring cavity (PMC) • Bandwidth (FWHM) ~ 3.2 MHz 3e-8/rtHz
Up to 200 mm over 4 km Prediction applied to ref. cav. temp. (open loop) End test mass stackfine actuators relieveuncompensated residual Earth Tide Compensation 100mm prediction residual
Concept for Advanced LIGO laser • Being developed by GEO/LZH • Injection-locked, end-pumped slave lasers • 180 W output with 1200 W of pump light
LZH/MPI Hannover Integrated front end based onGEO 600 laser – 12-14 watts High-power slave – 195 wattsM2 < 1.15 Brassboard Performance
Core Optics – Test Masses • Low-absorption fused silica substrates • 25 cm dia. x 10 cm thick, 20 kg • Low-loss ion beam coatings • Suspended from single loop of music wire (0.3 mm) • Rare-earth magnets glued to face and side for orientation actuation • Internal mode Qs > 2e6
RITM ~ 14 km (sagitta ~ 0.6 l) ; RETM ~ 8 km Surface uniformity ~ l/100 over 20 cm. dia. (~ 1 nm rms) “Super-polished” – micro-roughness < 1 Angstrom Scatter (diffuse and aperture diffraction) < 30 ppm Substrate absorption < 4 ppm/cm Coating absorption < 0.5 ppm LIGO I core optics Caltech data
Adv. LIGO Core Optics • LIGO recently chose fused silica over sapphire • Familiarity and experience with polishing, coating, suspending, thermally compensating, etc. – less perceived risk • Other projects (e.g. LCGT) still pursuing sapphire test masses • Thermal noise in coatings expected to be greatest challenge fused silica sapphire 38 cm dia., 15.4 cm thick, 38 kg
Processing, Installation and Alignment Experience indicatesthat processing andhandling may besource of optical loss gluingvacuum baking wet cleaning suspendingbalancing transporting
Circulating power in arm cavities ~ 25 kW for inital LIGO ~ 600 kW for adv. LIGO Substrate bulk absorption ~ 4 ppm/cm for initial LIGO ~ 0.5 ppm/cm ($) for adv. LIGO Coating absorption ~ 0.5 ppm for initial & adv. LIGO Thermo-optic coefficient dn/dT ~ 8.7 ppm/degK Thermal expansion coefficient 0.55 ppm/degK “Cold” radius of curvature of optics adjusted for expected “hot” state Thermal Issues Surface absorption depth radius Bulk absorption
Coating vs. substrate absorption Surface distortion Optical path difference • OPD almost same for same amount of power absorbed in coating or substrate • Power absorbed in coating causes more surface distortion than same power absorbed in bulk
ITM Compensation Plates PRM ITM SRM ? Thermal compensation system CO2 Laser ZnSe Viewport ITM Over-heat Correction Under-heat Correction Inhomogeneous Correction Adv. LIGOconcept
ITMY ITMX Anomalous absorption in H1 ifo. • Negative values imply annulusheating • Significantly more absorption in BS/ITMX than in ITMY • How to identify absorption site? TCS power is absorbedin HR coatings of ITMs
Need for remote diagnostics • Water absorption in viton spring seats makes vacuum incursions very costly. • Even with dry air purge, experience indicatesthat 1-2 weeks pumping required per 8 hours vented before beam tubes can be exposed to chambers • Development of remote diagnostics to develop which optics responsible of excess absorption
Spot size measurements • BeamView CCD cameras in ghost beams from AR coatings • Lock ifo. w/o TCS heating • Measure spot size changes as ifo. cools from full lock state • Curvature change in ITMX path about twice that in ITMY path ITMX ITMY
Arm cavity g factor changes • Again, lock full ifo. w/o TCS heating, break lock, lock single arm and measure arm cavity g factor at precise intervals after breaking lock • g factor change in Xarm larger than Yarm by factor of ~ 1.6 • Calibrate with TCS (ITM-only surface absorption)
Results and options • Beamsplitter not significant absorber • ITMX is a significant absorber~ 25 mW/watt incident • ITMY absorption also high~ 10 mW/watt incident • Factor of ~5 greater than absorption in H2 or L1 ITMs • Options • Try to clean ITMX in situ • Replace ITMX • Higher power TCS system • 30-watt TCS laser presently being tested ETM surface ITM surface ITM bulk
Measurement Technique • Dynamic resonance of light in Fabry-Perot cavities (Rakhmanov, Savage, Reitze, Tanner 2002 Phys. Lett. A, 305 239). • Laser frequency to PDH signal transfer function, Hw(s), has cusps at multiples of FSR and features at freqs. related to the phase modulation sidebands.
Misaligned cavity • Features appear at frequencies related to higher-order transverse modes. • Transverse mode spacing:ftm = f01- f00 = (ffsr/p) acos (g1g2)1/2 • g1,2 = 1 - L/R1,2 • Infer mirror curvature changes from transverse mode spacing freq. changes. • This technique proposed by F. Bondu, Aug. 2002.Rakhmanov, Debieu, Bondu, Savage, Class. Quantum Grav.21 (2004) S487-S492.
H1 data – Sept. 23, 2003 • Lock a single arm • Mis-align input beam (MMT3) in yaw • Drive VCO test input (laser freq.) • Measure TF to ASPD Qmon or Imon signal • Focus on phase of feature near 63 kHz 2ffsr- ftm
Data and (lsqcurvefit) fits. ITMx TCS annulus heating decrease in ROC (increase in curvature) R = 14337 m R = 14096 m Assume metrology value for RETMx = 7260 m Metrology value for ITMx = 14240 m