Download

1 / 40
400 likes | 512 Views
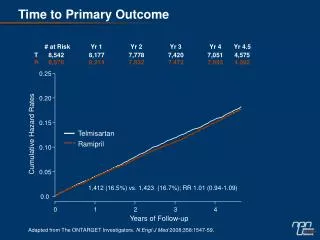
Follow-up of ACE on Structures with emphasis on issues addressed in the ACE review and recent developments . Outline. Accelerating structures Design, high-power limits Production High-power testing PETS Simulation and design High-power testing Organizational.

E N D
Follow-up of ACE on Structures with emphasis on issues addressed in the ACE review and recent developments W. Wuensch, CLIC ACE 10-2-2008
Outline • Accelerating structures • Design, high-power limits • Production • High-power testing • PETS • Simulation and design • High-power testing • Organizational W. Wuensch, CLIC ACE 10-2-2008
Design, high-power limits • Nominal CLIC structure has not changed – still CLIC_G! Optimization procedure has been applied to 500 GeV CLIC (next talk). • Intensified effort to improve high-power constraints: • Empirical approach - Continuing effort to analyze data as it becomes available. • Theoretical approach - Collaboration forming for breakdown theory, modeling and dedicated experiments: Surface physics simulations (HIP Finland) for breakdown trigger and input for plasma simulations. Plasma simulations (IPP Greifswald, IAP Ukraine) for coupling to rf and damage mechanism. Diagnostics (IAP Ukraine, CERN). Electron tracking missing, some work started at SLAC. W. Wuensch, CLIC ACE 10-2-2008
Summary of high-gradient tests Sc = Re{S} + Im{S}/6 A. Grudiev
Towards integrated modeling of arcing MPI Greifswald K. Matyash R. Schneider HIP, Helsinki H. Timko F. Djurabekova K. Nordlund • Integrated Particle-in-Cell and Molecular • Dynamics modeling of arcing • electric field concentrated in sheath • triggered by electron field emission • energetic particles create surface damage • explains experimentally observed cluster emission • scaling studies on the way • Cern PhD student position applied for Helga Timko
Plasma Diagnostics: Optical Emission Spectroscopy Experimental data from the measurements on CLIC DC spark setup Analysis and interpretation of data ( IAP NASU) Main results : There are high intensity optical line (copper, nitrogen, oxygen) It is necessary to take into account plasma processes Institute of Applied Physics National Academy of Sciences of Ukraine, Sumy
Theoretical research and simulation on electron and ion beam formation in DC-spark and RF-breakdown Particle balance equation Poisson equation A Lorentz equation Intensity of radiation C PLASMA Institute of Applied Physics National Academy of Sciences of Ukraine, Sumy
RF and DC test stand instrumentation for breakdown research Jan W. Kovermann, CERN, RWTH Aachen Measurements in RF and DC experiments are needed to develop and support breakdown models and simulations Neutral Cu lines, T(plasma) ~ 8000K – 16000K (prelim.) • A breakdown emits electromagnetic radiation from infrared to x-rays: • An analysis of that radiation can reveal information about the processes during a breakdown • A time-resolved acquisition can additionally help to discover the chronological sequence of these processes • The measured values like plasma temperature, composition, density and their time development will be used as input for a breakdown model and corresponding simulations • Complementary experiments like RF diagnostics of the plasma are under development Breakdown in RF structure
Leading candidate alloys of today S. Heikkinen
High-power testing program KEK-SLAC-CERN collaboration on structure development is very solid now. Master schedule – covers fabrication and testing, at CERN, KEK and SLAC. By structure type and by test area. Recent test result highlights. W. Wuensch, CLIC ACE 10-2-2008
CLIC test structures VG1 family CLIC G family C10 family 30 GHz Structures: 2Disk undamped 11.4 GHz 2 With damped compact coupler 11.4 GHz 2 Disk damped 11.4 GHz 1 Disk undamped 12 GHz 1 Disk damped 12 GHz Structures: 2 vg07 undamped (SLAC) 4 vg1.35 undamped (2 SLAC; 2 KEK) 4 vg1.35 damped (2 CERN; 2 KEK) 2 vg2.25 undamped (SLAC) 2 vg3.3 undamped (SLAC) Structures: 1 Speed bump (underway) 1 reversed speed bump 1 TM02 1 T24 scaled version End of foreseen program Structures: 5 Disk undamped (1 CERN, 4 KEK)+ 1 reversed structure test 3 Disk damped (1 CERN,2 KEK) 5 Quadrant damped (2 CERN, 3 KEK) End of foreseen program • Objectives: • Study of frequency scaling • Breakdown physics study • Detailed analysis of RF pulses • Objectives: • Study of the scaling for different iris aperture/thickness and group velocity for constant impedance structures • Direct Comparison of damped/undamped constant impedance structures • Objectives: • Repeatability/statistic on 4 tests structures • Comparison of damped/undamped structures • Comparison of technology disk/quadrant • Objectives: • Reach CLIC nominal performances (100 MV/m @10-7 BDR) with a large efficiency structure (28%) • Comparison of damped/undamped structures • Test of the damped coupler • First 12 GHz structure to be test in TBTS R. Zennaro
X-band structure master schedule (1/2) G. Riddone
X-band structure master schedule (2/2) G. Riddone
30 GHz structure master schedule G. Riddone
Dashboard G. Riddone
Report from KEK Items • Structure fabrication • Quad • Quad bars for a structure ordered • Chamber design in progress • Disk-damp design • Mechanical design proposed, waiting for SLAC response • Nextef • Combined power >100MW for 260ns • One breakdowns / an hour or so at mostly near combiner • at acc. Structure >75MW • Sometimes breakdowns are observed. • The system to identify the BD at structure is in progress. • Start on Sep. 9 T. Higo
Nextef status System processing System stopped Stable run period Pulse width Combined To structure Power level is ~75MW at structure input with 260ns. Waveguides are under conditioning. Structure breakdowns are identified as shown in the left figure. Figure shows breakdown pulse and penultimate. We start with stopping system trigger after large reflected pulse and/or Faraday cup current burst. Pulse recording and analysis system is under preparation. T. Higo
Cumulated Phase Change T18 Structure Profile F. Wang Field Amplitude The structure is designed by CERN, built at KEK, assembled and bonded in SLAC and tested at SLAC (NLCTA). 120°
BKD Rate Characteristics at Different Conditioning Time RF BKD Rate Gradient Dependence for 230ns Pulse at Different Conditioning Time RF BKD Rate Pulse Width Dependence at Different Conditioning Time After 900hrs RF condition BKD rate has a gradient dependence ~ and pulse width dependence ~ F. Wang
BKD Distribution along Structure at Different Stage Based on the Time of RF Signal F. Wang
Major themes of the T18 test • NLC/JLC fabrication excellent, although cell 7 shows how careful we have to be (assuming there isn’t something fundamental). • Using quantitative high-power limits during design successfully produced high gradient structure even if limits are not exactly known yet. Improved limits will of course make process more effective. • Showing effect of waveguide damping is top priority now. • The other T18s will be very useful. Is behavior in cell 7 fundamental? Reversed test. • The CERN,KEK, SLAC collaboration is working super well. W. Wuensch, CLIC ACE 10-2-2008
30 GHz Speed bump results 70 ns S. Doebert Structure reached very similar performance as the old 3.5 mm structure(about 3 % difference lower in gradient for fixed breakdown rate)
PETS testing strategies PETS testing in “waveguide mode” (SLAC) PETS power production from the drive beam (CERN) RF high power source RF power RF power in RF power out Drive beam Objective: to demonstrate the reliable production of the nominal CLIC RF power level throughout the deceleration of the drive beam. • Objective: to understand the limiting factors for the PETS ultimate performance. • Access to the very high power levels (300 MW) and nominal CLIC pulse length. • High repetition rate – 60 Hz. I. Syratchev
Accelerating Structure Test Area at SLAC The uncompressed arm has a variable phase shifter and a gate valve Experimental area ASTA layout Gate valve Rf Phase shifter SLED II with variable length and iris reflection Uncompressed arm Two klystrons 50 MW@1.5us ASTA [1] is a new generation general purpose test stand, which will allow processing the various types of the high power RF equipment at X-band. The facility can provide a very versatile pulse length and power level. The ASTA pulse compressor with variable delay in delay-lines RF pulse @ power in the ASTA compressed arm 3dB hybrid CLIC PETS The ASTA pulse compressor with variable iris Typical RF pulse envelope in the ASTA compressed arm. The SLED II operates in dual mode regime I. Syratchev
11.424 GHz PETS ( design scaled from the CLIC 12 GHz PETS). RF acceptance test. Assembly of the eight PETS bars. Special matching cell PETS couplers The bars fabricated using high speed milling Tolerance by design: ± 0.015mm PETS during RF check PETS before the last EB welding Reflection, dB Transmission, dB Frequency, GHz The 11.424 GHz PETS RF measurements: diamonds - reflection, circles – transmission. I. Syratchev
11.424 GHz PETS after final assembly. 11. 424 GHz PETS measurements after final assembly I. Syratchev
12 GHz PETS test assembly for RF measurements PETS octants assembly 8 bars, as received from VDL PETS equipped with the power couplers and electronic ruler with pick-up antenna for the phase advance measurements. I. Syratchev
12 GHz PETS RF measurements results TBTS PETS RF Measurement results Ohmic efficiency budget: Assuming theoretical losses in the PETS regular part, the power coupler ohmic efficiency is 0.986 (cf HFSS results – 0.99). Group delay: Measured: Coupler-to-coupler, DC = 2.0 ns The whole PETS DP = 9.36 ns Active length: Dp-DC = 7.36 ns Calculated: D=L active/(C) = 1.015/(0.459*C)= 7.35 ns I. Syratchev
The S21 vector readings measured during the antenna movement. 01 August 2008 Sliding antenna raw data -10 MHz Sliding antenna measurements (F=11.992 GHz) -5 MHz -30 MHz 0 MHz +5 MHz +10 MHz Antenna (loop) is positioned at the centre of one of the eight slot. The distance between the edge of antenna and the slot opening is ~ 1mm. Coupling: -45 dB I. Syratchev
Raw data (example) F, MHz φ/cell Reconstructed ‘local’ dispersion curve -30 89.53 -10 89.91 -5 90.02 0 90.13 +5 90.24 +10 90.37 +30 90.78 Sliding antenna results The phase at the position of each of the measured local peak The interleaved (all cells) phase slope The phase slope linear fit: Phase, degrees The phase advance per cell now can be calculated as: φ cell = 90 - φ; - 30 MHz local peak Cell number Amplitude Readings number Speed of light line Power, norm PETS detuning MHz The measured synchronous frequency of the TBTS PETS is 11.983 GHz at air and 25 0C (9 MHz lower the nominal one) For the measured TBTS PETS detuning (9 MHz), the power production efficiency of 99.6% is expected. I. Syratchev
Bead pull measurements bead post - 30 MHz - 20 MHz - 12 MHz - 10 MHz Bead position in PETS (bead diameter 3mm) - 8 MHz 0 MHz + 10 MHz + 20 MHz Post pull measurements The bead/post pull measurements confirmed the sliding antenna results. The 900 phase advance/cell is established at the frequency detuned by ~7-8 MHz from the designed one. - 30 MHz - 20 MHz - 10 MHz 0 MHz + 10 MHz + 20 MHz I. Syratchev
12 GHz TBTS PETS final assembly I. Syratchev
12 GHz PETS RF measurements results TBTS PETS RF Measurement results after final assembly Ohmic efficiency budget: Assuming theoretical losses in the PETS regular part, the power coupler ohmic efficiency is 0.992 (cf HFSS results – 0.99). Group delay: Measured: Coupler-to-coupler, DC = 2.0 ns The whole PETS DP = 10.05 ns Active length: Dp-DC = 7.47 ns Calculated: D=L active/(C) = 1.015/(0.459*C)= 7.35 ns I. Syratchev
PETS tank under vacuum leak test (29.08.2008) I. Syratchev
12 GHz attenuator Port 2 Port 3 Port 4 Port 1 Expected PETS power production with re-circulation (low current mode) CLIC nominal 6.0 A 5.0 A 4.0 A 3.5 A 240 ns CLIC nominal I. Syratchev
PETS simulations at SLAC with computer code ATAU The wake simulated with GDFIDL (red) and ATAU (blue) I. Syratchev
Structure development organization W. Wuensch, CLIC ACE 10-2-2008