Download
1 / 24
240 likes | 360 Views
Economics of WWI. Redemption Jon Nacionales. Overview of the War.

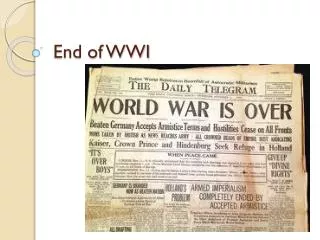
E N D
Economics of WWI Redemption Jon Nacionales
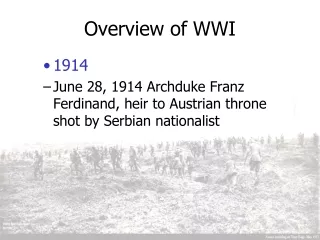
Overview of the War • Please don’t ask me what WWI was because then I’ll be pretty disappointed. We studied the background in the social science packet. If you still don’t know anything read the Social Science packet and DemiDec and go to this really cool website that has information all about WWI: • https://www.google.com
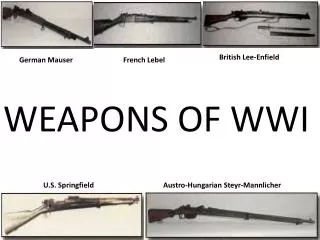
*Most British Economic Warfare • Established naval blockade of Germany, effectively stopping ALL* American trade with the Central Powers. • Germany use U-Boats in effort to isolate Britain
France • “France suffered the greatest cost, the most extensive physical damage, and the most significant economic disruptions.” • Army of 5 million men (most came from private industry) • 1913 government spending raises by 10% • 1918 government spending raises by 53.5%
Italy • Italy had a relatively underdeveloped economy to begin with=limited mobilization • Supreme Committee of Ministers & Under-Secretariat for Arms and Munitions took over private factories and forced private firms for war benefit. • The mechanical and engineering industries and hydroelectricity experience greatest gains. Automotive industry : FIAT • “the output increases in war- related sectors were obtained largely at the cost of running down stock elsewhere”
Russia • “Backwards economy” • 1914—Income per capita was 11-30% of United States • August 1914-December 1917—24% in annual national income goes to war • Russia leaves in 1917 and America enters=limited consequences
1917—Enter America • Lusitania—May 17, 1915 • Sussex—1916 • Sussex Pledge—March 1917 • Zimmerman—March 1, 1917 • America Enters—April 6, 1917
American Mobilization • America faces same production goals as Europe + Atlantic Ocean • 24.2M men register, 2.8 fight • men received 6 mo. training prior and 2 mo. after • America sent 7.5 million tons of cargo, only 200,000 was lost • How to transport men? ½ British Ships + ½ Emergency Fleet Corporation = 2M tons of ships
The War Industries Board (WIB) Est. July 1917 • In charge of the government’s procurement of war goods • Set very high prices on goods (Price Fixing Committee aka PFC) • Bulk-line pricing system • “Under such a pricing strategy, the government would decide what fraction of an industry’s total output it needed for the war effort, and it would set a price just high enough to reach that level of output.”
Bulk Line Pricing • Demand was more than supply=Shortages • In free market prices would increase • War market prices are fixed • Government sets priority system (AA, A, B, C, D)
Parts WIB • Price Fixing Committee • The Food Administration • The Railroad Administration • The Fuel Administration
The Food Administratrion • Lever Food and Fuel Act in August 1917—Herbert Hoover • NO food rationing and price control • YES volunteer • Meatless Mondays • Wheatless days • Porkless days • Food licensing • No volunteers? No license.
The Railroad Administration • President Wilson nationalized the railway system from 1917-1920 • “unable to earn net income sufficient for them to maintain their credit and to attract new capital for needed enlargements and improvements in facilities...” • Make railroads more efficient for transporting war goods and TROOPS. • 610,000 troops every month • 13,912 trains over 800 miles
The Fuel Administration • Created by President Wilson from August 1917-1919 • Set coal prices • Work with Railroad Administration to deliver coal and fuel.
Costs of War • Net cost = Gross cost – “advances”/loans to Alliances • Total cost = indirect + direct • Total cost = $338,850,000,000
Indirect Costs • opportunity costs • property losses, shipping and cargo losses, lost production, war relief, and the capitalized value of civilian and soldier deaths • what they could’ve earned