Download
1 / 61
610 likes | 763 Views
History and Data on Juvenile Treatment Drug Courts. Michael L. Dennis, Ph.D. Chestnut Health Systems Normal, IL Presentation at the Center for Substance Abuse Treatment (CSAT) Juvenile Treatment Drug Court (JTDC) Orientation Meeting,

E N D
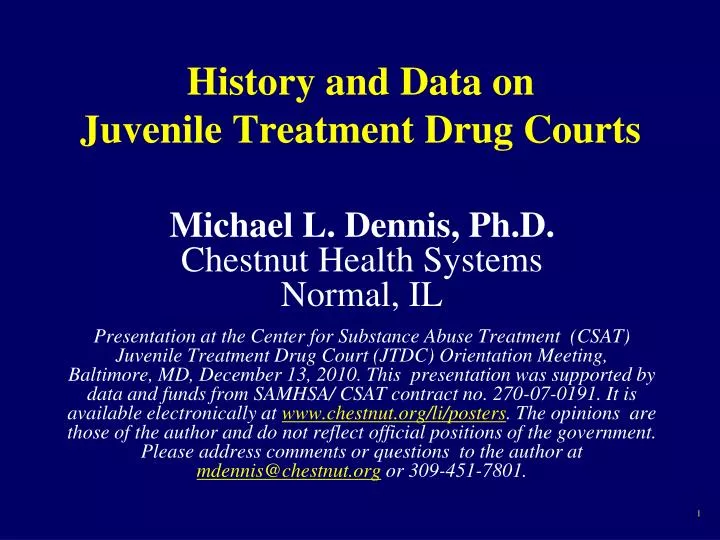
History and Data on Juvenile Treatment Drug Courts Michael L. Dennis, Ph.D. Chestnut Health Systems Normal, IL Presentation at the Center for Substance Abuse Treatment (CSAT) Juvenile Treatment Drug Court (JTDC) Orientation Meeting, Baltimore, MD, December 13, 2010. This presentation was supported by data and funds from SAMHSA/ CSAT contract no. 270-07-0191. It is available electronically at www.chestnut.org/li/posters. The opinions are those of the author and do not reflect official positions of the government. Please address comments or questions to the author at mdennis@chestnut.org or 309-451-7801.
The Goals of this Presentation are to: • Illustrate why it is so important to intervene with juvenile drug users • Review what we know about juvenile treatment drug courts (JTDC) so far • Compare JTDC to regular adolescent outpatient (AOP) in terms of who is served, what services they receive and their treatment outcomes • Examine other lessons from juvenile justice and adolescent treatment studies to date.
Over 90% of use and problems start between the ages of 12-20 It takes decades before most recover or die Alcohol and Other Drug Abuse, Dependence and Problem Use Peaks at Age 20 100 People with drug dependence die an average of 22.5 years sooner than those without a diagnosis 90 Percentage 80 70 60 Severity Category 50 Other drug or heavy alcohol use in the past year 40 30 Alcohol or Drug Use (AOD) Abuse or Dependence in the past year 20 10 0 65+ 12-13 14-15 16-17 18-20 21-29 30-34 35-49 50-64 Age Source: 2002 NSDUH and Dennis & Scott, 2007, Neumark et al., 2000
Adolescents who use weekly or more often are more likely during the past year to have .. Source: Dennis, White & Ives, 2009
pain Adolescent Brain Development Occurs from the Inside to Out and from Back to Front Photo courtesy of the NIDA Web site. From A Slide Teaching Packet: The Brain and the Actions of Cocaine, Opiates, and Marijuana.
Prolonged Substance Use Injures The Brain: Healing Takes Time Normal levels of brain activity in PET scans show up in yellow to red Normal Reduced brain activity after regular use can be seen even after 10 days of abstinence 10 days of abstinence After 100 days of abstinence, we can see brain activity “starting” to recover 100 days of abstinence Source: Volkow ND, Hitzemann R, Wang C-I, Fowler IS, Wolf AP, Dewey SL. Long-term frontal brain metabolic changes in cocaine abusers. Synapse 11:184-190, 1992; Volkow ND, Fowler JS, Wang G-J, Hitzemann R, Logan J, Schlyer D, Dewey 5, Wolf AP. Decreased dopamine D2 receptor availability is associated with reduced frontal metabolism in cocaine abusers. Synapse 14:169-177, 1993.
Other Life Course Reasons to Focus on Adolescents • People who start using under age 15 use 60% more years than those who start over age 18 • Entering treatment within the first 9 years of initial use leads to 57% fewer years of substance use than those who do not start treatment until after 20 years of use • Relapse is common and it takes an average of 3 to 4 treatment admissions over 8 to 9 years before half reach recovery • Of all people with abuse or dependence 2/3rds do eventually reach a state of recovery • Monitoring and early re-intervention with adults has been shown to cut the time from relapse to readmission by 65%, increase abstinence and improve long term outcomes Source: Dennis et al., 2005, 2007; Scott & Dennis 2009
What Is Treatment? • Motivational interviewing and other protocols to help them understand how their problems are related to their substance use and that they are solvable • Detoxification and medication to reduce pain/risk of withdrawal and relapse, including tobacco cessation • Evaluation of antecedents and consequences of use • Group, individual or family outpatient including relapse prevention planning • More systemic family approaches • Proactive urine monitoring • Motivational incentives / contingency management • Residential, intensive outpatient (IOP) and other types of structured environments to reduce short term risk of relapse • Access to communities of recovery for long term support, including 12-step, recovery coaches, recovery schools, recovery housing, workplace programs • Continuing care, phases for multiple admission
Few Get Treatment: 1 in 19 adolescents, 1 in 21 young adults, 1 in 12 adults While Substance Use Disorders are Common, Treatment Participation Rates Are Low Over 88% of adolescent and young adult treatment and over 50% of adult treatment is publicly funded Much of the private funding is limited to 30 days or less and authorized day by day or week by week Source: OAS, 2009 – 2006, 2007, and 2008 NSDUH
Other Problems With the U.S. Treatment System • Less than 75% stay the 90 days recommended by NIDA (half less than 50 days) • Less than half are positively discharge • Less than 10% leaving higher levels of care are transferred to outpatient continuing care • The majority of programs do NOT use standardized assessment, evidenced based treatment, track the clinical fidelity of the treatment they provide or monitor their own performance in terms of client outcomes • Average staff education is an Associate Degree • Staff stay on the job an average of 2 years
What does an episode of treatment cost? • $750 per night in Detox • $1,115 per night in hospital • $13,000 per week in intensive • care for premature baby • $27,000 per robbery • $67,000 per assault $70,000/year to keep a child in detention $22,000 / year to incarcerate an adult $30,000/ child-year in foster care Source: French et al., 2008; Chandler et al., 2009; Capriccioso, 2004
Investing in Treatment has a Positive Annual Return on Investment (ROI) • Substance abuse treatment has been shown to have a ROI within the year of between $1.28 to $7.26 per dollar invested • Best estimates are that Treatment Drug Courts have an average ROI of $2.14 to $2.71 per dollar invested This also means that for every dollar treatment is cut, we lose more money than was saved. Source: Bhati et al., (2008); Ettner et al., (2006)
Background Juvenile Justice System and Substance Use • About half of the youth in the juvenile justice system have drug related problems (Office of Juvenile Justice and Delinquency Prevention (OJJDP), 2001; Teplin et al., 2002). • Juvenile justice systems are the leading source of referral among adolescents entering treatment for substance use problems (Dennis et al., 2003; Dennis, White & Ives, 2009) • By late 2004, there were 357 juvenile treatment drug courts and the number of courts has continued to grow at a rate of 30-50% per year. • Source: Dennis, White & Ives, 2009
What are the Recommended Components of a Juvenile Treatment Drug Court? • Formal Screening Process for early identification and referral for substance use and other disorders/needs • Multidimensional standardized assessment to guide clinical decision making related to diagnosis, treatment planning, placement and outcome monitoring • Interdisciplinary treatment drug court team • Comprehensive non-adversarial team-developed treatment plan, including youth and family • Continuum of substance-abuse treatment and other rehabilitative services to address the youths needs • Use of Evidenced Based Treatment Practices Source: Adapted from Henggeler (2007) and the National Association of Drug Court Professionals (NADCP, 1997) principals for drug court.
What are the Recommended Components of a Juvenile Treatment Drug Court? (continued) • Monitoring progress through urine screens and weekly interdisciplinary treatment drug court team staffings • Feedback to the judge followed by graduated performance-based rewards and sanctions • Reducing judicial involvement from weekly to monthly with evidence of favorable behavior change over a year or longer • Advanced agreement between parties on how on assessment information will be used to avoid self incrimination • Use of information technology to connect parties and proactively monitor implementation at the client and program level Source: Adapted from Henggeler (2007) and the National Association of Drug Court Professionals (NADCP, 1997) principals for drug court.
Science What Level of Evidenced is Available on the Effectiveness of Drug Courts? Law Meta Analyses of Experiments/ Quasi Experiments (Summary v Predictive, Specificity, Replicated, Consistency) Dismantling/ Matching study (What worked for whom) Experimental Studies (Multi-site,Independent,Replicated, Fidelity, Consistency) Quasi-Experiments (Quality of Matching, Multi-site,Independent,Replicated, Consistency) Pre-Post (multiple waves), Expert Consensus Correlation and Observational studies Case Studies, Focus Groups Pre-data Theories, Logic Models Anecdotes, Analogies STRONGER Beyond a Reasonable Doubt Clear and Convincing Evidence Preponderance of the Evidence Probable Cause Reasonable Suspicion Source: Marlowe 2008
Science What Level of Evidenced is Available on the Effectiveness of Drug Courts? Law Meta Analyses of Experiments/ Quasi Experiments (Summary v Predictive, Specificity, Replicated, Consistency) Dismantling/ Matching study (What worked for whom) Experimental Studies (Multi-site,Independent,Replicated, Fidelity, Consistency) Quasi-Experiments (Quality of Matching, Multi-site,Independent,Replicated, Consistency) Pre-Post (multiple waves), Expert Consensus Correlation and Observational studies Case Studies, Focus Groups Pre-data Theories, Logic Models Anecdotes, Analogies STRONGER Beyond a Reasonable Doubt Adult Drug Treatment Courts: 5 meta analyses of 76 studies found crime reduced 7-26% with $1.74 to $6.32 return on investment Clear and Convincing Evidence DWI Treatment Courts: one quasi experiment and five observational studies positive findings Preponderance of the Evidence Family Drug Treatment Courts: one multisite quasi experiment with positive findings for parent and child Probable Cause Juvenile Drug Treatment Courts – one 2006 experiment, one in press large multisite quasi-experiment, & several small studies with similar or better effects than regular adolescent outpatient treatment Reasonable Suspicion Source: Marlowe 2008
Juvenile Treatment Drug Court Effectiveness • Low levels of successful program completion among youths in drug courts was noticeable in several early studies (Applegate & Santana, 2000; Miller, Scocas & O’Connell, 1998; Rodriguez & Webb, 2004) • Youths in drug court treatment were no more likely to recidivate over a two-year post-release period than youths being treated in an adolescent substance abuse treatment program (Sloan, Smykla & Rush, 2004). • In a randomized controlled trial, a JTDC was found to be more effective than traditional family court with community service in reducing adolescent substance abuse (particularly when using evidence-based treatment) and criminal involvement during treatment (Henggeler, et al., 2006)
Change in Substance Use By Condition* Family Court w community service Drug Court (d=0.8) Drug Court plus Multi-Systemic Therapy (MST) (d=1.4) Drug Court plus MST & contingency Management (d=1.6) 4 months Pre-Intake 12 months Source: Henggeler et al 2006 *p < .05
Change in General Delinquency By Condition* Family Court w community service Drug Court plus MST & contingency Management (d=0.80) Drug Court plus Multi-Systemic Therapy (MST) (d=0.80) Drug Court (d=0.90) 4 months Pre-Intake 12 months Source: Henggeler et al 2006 *p < .05
Strengths & Limits ofHenggeler et al 2006 • Strengths • Random assignment • Replicable evidenced based practice • High fidelity implementation • Multiple follow-up waves • Self report, urine test & records • Limits • Single site • Small sample size (29-37 per condition) • Differences at intake in spite of randomization • Variation in findings by outcome measure
Findings from Ives et al (in press) Multi-Site Quasi Experiment • How do the severity & needs of youth in Juvenile Treatment Drug Courts (JTDC) compare to those Adolescent Outpatient (AOP) • Controlling for these differences, how do they compare in terms of • The services they receive? • Their treatment outcomes?
Juvenile Treatment Drug Court (JTDC) Sample • Cohort of 13 CSAT JTDC grantee sites using the GAIN in Laredo, TX, San Antonio, TX, Belmont, CA, Tarzana, CA, Pontiac, MI, Birmingham, AL, San Jose, CA, Austin, TX, Peabody, MA, Providence, RI, Detroit, MI, Philadelphia, PA, and Basin, WY. • Intake data collected from these sites on N=1,786 adolescents between January 2006 through March 31, 2009. • The records were limited to clients who: • Received outpatient treatment (N=1,445), and • Had attained 6 months post-intake (N=1,265) • For the analysis, only those with at least one follow-up assessment (89%) were used for a final N=1,120 • 86% received evidence-based treatment Source: Ives et al., in press
Adolescent Outpatient (AOP) Sample • Clients receiving AOP treatment from 75 CSAT-funded sites using the GAIN and providing outpatient treatment in 29 states from five grant programs (N=10,037). • Intake data collected from these sites on n=10,037 adolescents between September 2002 and August 2008. • The records were limited to clients who: • Received outpatient treatment (all), and • Had attained 6 months post-intake (N=8,604) • For the analysis, only those with at least one follow-up assessment (88%) were used for a final N=7,560 • 93% received evidence-based treatment. JTDC & AOP were significantly different on 36 of 69 measures of characteristics, severity and treatment need Source: Ives et al., in press
Demographics JTDC less likely to be Caucasian, older, employed, & in trouble at school/work; more likely to be Hispanic/ Mixed, Behind in school, Source: Ives et al., in press * p<.05
Crime and Violence JTDC more likely have been in a controlled environment 13+ days, engaged in illegal activity (overall & drug related) Source: Ives et al., in press * p<.05
Intensity of Juvenile Justice System Involvement JTDC more likely to be in other JJ status and less likely to have no JJ status Source: Ives et al., in press * p<.05
Environmental Risk Factors JTDC less likely to have use in home and victimization Source: Ives et al., in press * p<.05
Substance Use JTDC more likely to have started sooner, use more often and to use marijuana; Less likely to use tobacco Source: Ives et al., in press * p<.05
Substance Use Disorders JTDC similar on substance use disorders Source: Ives et al., in press * p<.05
Substance Treatment History JTDC more likely to have been in treatment before and to be ready to quit * p<.05 Source: Ives et al., in press
Other Major Co-Occurring Clinical Problems JTDC less likely to have health or internalizing disorders * p<.05 Source: Ives et al., in press
HIV Risk Behaivors (past 90 days) Source: Ives et al., in press * p<.05
Number of Major Clinical Problems* *Count of marijuana use disorder, alcohol use disorder, any other drug use disorder, internalizing problems including: depression, anxiety, homicidal/suicidal thoughts, and trauma, externalizing problems including conduct disorder and ADHD, Lifetime victimization, past year acts of physical violence or past year illegal activity. JTDC slightly less severe on psychopathology – relative to waiting for them to come on their own, it is a form of early intervention * p<.05 Source: Ives et al., in press
Matching with Propensity Scores • Using logistic regression to predict the likelihood (propensity) of each AOP client being a JTDC client based on the 69 intake characteristics, we weighted the AOP group to match the JTDC group in terms of these characteristics and sample size. • This produced two groups with equal sample sizes (n=1,120) and reduced the number of significant differences from 39 to 3 Of 69 intake variables • Those in JTDC were still significantly • Less likely to be African American (OR=0.77) • More likely to be Hispanic (OR=1.44) and on other probation, parole, or detention (OR=1.37) Source: Ives et al., in press
Treatment System Involvement JTDC less likely to initiate within 2 weeks, but more likely to be in treatment 6 weeks and 3 months later. Source: Ives et al., in press *p <.05
Substance Abuse Treatment (intake to 3 months) JTDC received more days of any treatment & IOP, also more satisfaction Source: Ives et al., in press *p <.05
Range of Substance Abuse Treatment Content(Intake to 3 months) JTDC more likely to receive a broader range of services – particularly family and external wrap around services Source: Ives et al., in press *p <.05
Mental Health Treatment Received(intake to 3 months) Source: Ives et al., in press *p <.05
Other Environmental Inteventions Across Systems (intake to 3 months) JTDC received more urine tests and went to self help more often Source: Ives et al., in press *p <.05
JTDC Reduced Use More than AOP (d between= -0.24) Comparison of Treatment Outcomes(Days of ..) Others Outcomes Not Significantly Different Post-Pre d (AOP, JTDC) Illegal Activity (d=-0.11, -0.02) Substance Use* ( d=-0.45, -0.57) Emotional Problems (d=-0.32, -0.22) Trouble w/ Family (d= -0.23, -0.18) In Controlled Environment (d=-0.02, -0.08) Source: Ives et al., in press *p<.05 change greater for JTDC vs AOP (d=-0.24)
Strengths & Limits ofIves et al in press • Strengths • Multisite quasi assignment • Differences at intake eliminated on most variables • Replicable evidenced based practice • Multiple follow-up waves • Large sample size and high follow-up rates • Limits • Not randomized • Disproportionately Hispanic youth • Unknown fidelity of implementation • Not sufficient numbers of specific evidenced based practices to compare
Major Predictors of Bigger Effects Found in Multiple Meta Analyses (Lipsey, 1997, 2005) • A strong intervention protocol based on prior evidence • Quality assurance to ensure protocol adherence and project implementation • Proactive case supervision of individual • Triage to focus on the highest severity subgroup
Impact of the numbers of these Favorable features on Recidivism in 509 Juvenile Justice Studies in Lipsey Meta Analysis The more features, the lower the recidivism Average Practice Source: Adapted from Lipsey, 1997, 2005
Evidenced Based Treatment (EBT) that Typically do Better than Usual Practice in Reducing Juvenile Use & Recidivism • Adolescent Community Reinforcement Approach (A-CRA) • Aggression Replacement Training (ART) • Assertive Continuing Care (ACC) • Cognitive Behavior Therapy (CBT) • Functional Family Therapy (FFT) • Moral Reconation Therapy (MRT) • Thinking for a Change (TFC) • Interpersonal Social Problem Solving (ISPS) • Motivational Enhancement Therapy/Cognitive Behavior Therapy (MET/CBT) • Motivational Interviewing (MI) • Multi Systemic Therapy (MST) • Multidimensional Family Therapy (MDFT) • Reasoning & Rehabilitation (RR) • Seven Challenges (7C) Small or no differences in mean effect size between these brand names Source: Adapted from Lipsey et al 2001, 2010; Waldron et al, 2001, Dennis et al, 2004
But better than the average for OP in ATM (200 days of abstinence) Cannabis Youth Treatment (CYT): Similarity of Clinical Outcomes Not significantly different by condition. Trial 2 Trial 1 300 50% . 280 40% . 260 30% over 12 months at Month 12 Total days abstinent Percent in Recovery 240 20% 220 10% 200 0% MET/ CBT5 MET/ FSN MET/ CBT5 ACRA MDFT (n=102) CBT12 (n=102) (n=99) (n=100) (n=99) 269 256 260 251 265 257 Total Days Abstinent* 0.28 0.17 0.22 0.23 0.34 0.19 Percent in Recovery** * n.s.d., effect size f=0.06 * n.s.d., effect size f=0.06 ** n.s.d., effect size f=0.12 ** n.s.d., effect size f=0.16 Source: Dennis et al., 2004
ACRA did better than MET/CBT5, and both did better than MDFT MET/CBT5 and 12 did better than FSN Moderate to large differences in Cost-Effectiveness by Condition Trial 2 Trial 1 $20 $20,000 $16 $16,000 $12 $12,000 Cost per person in recovery at month 12 over 12 months Cost per day of abstinence $8 $8,000 $4 $4,000 $0 $0 MET/ MET/ CBT5 MET/ CBT5 FSN ACRA MDFT CBT12 $4.91 $6.15 $15.13 $9.00 $6.62 $10.38 CPDA* $3,958 $7,377 $15,116 $6,611 $4,460 $11,775 CPPR** * p<.05 effect size f=0.48 * p<.05 effect size f=0.22 ** p<.05, effect size f=0.72 ** p<.05, effect size f=0.78 Source: Dennis et al., 2004
Evidenced Based Practices Can be SIMPLE: On-site proactive urine testing can be used to reduce false negatives by more than half
Implementation is Essential(Reduction in Recidivism from .50 Control Group Rate) The best is to have a strong program implemented well The effect of a well implemented weak program is as big as a strong program implemented poorly Thus one should optimally pick the strongest intervention that one can implement well Source: Adapted from Lipsey, 1997, 2005
Percentage Change in Abstinence (6 mo-Intake) by level of Adolescent Community Reinforcement Approach (A-CRA) Quality Assurance Effects associated with Coaching, Certification and Monitoring (OR7.6) Source: CSAT 2008 SA Dataset subset to 6 Month Follow up (n=1,961) 50