Download
1 / 36
360 likes | 375 Views
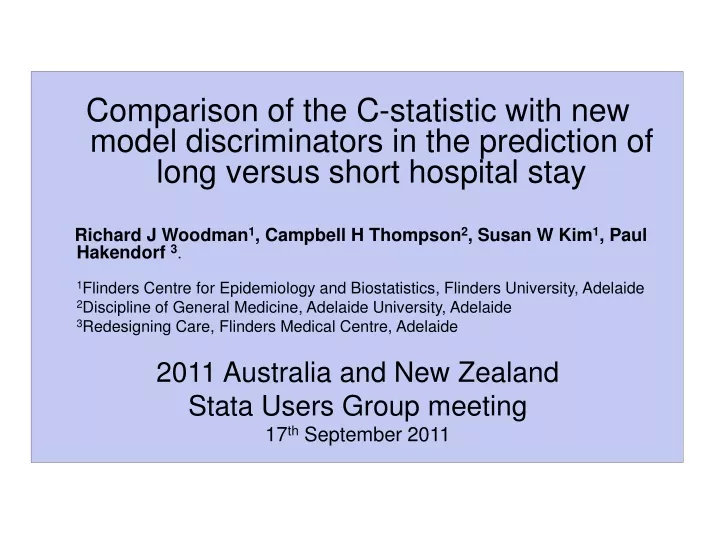
Comparison of the C-statistic with new model discriminators in the prediction of long versus short hospital stay Richard J Woodman 1 , Campbell H Thompson 2 , Susan W Kim 1 , Paul Hakendorf 3 . 1 Flinders Centre for Epidemiology and Biostatistics, Flinders University, Adelaide

E N D
Comparison of the C-statistic with new model discriminators in the prediction of long versus short hospital stay Richard J Woodman1, Campbell H Thompson2, Susan W Kim1, Paul Hakendorf 3. 1Flinders Centre for Epidemiology and Biostatistics, Flinders University, Adelaide 2Discipline of General Medicine, Adelaide University, Adelaide 3Redesigning Care, Flinders Medical Centre, Adelaide 2011 Australia and New Zealand Stata Users Group meeting 17th September 2011
^ ^ Usefulness of new predictors • Meaningful new risk predictors • Traditionally rely on the Concordance statistic (C-statistic / ROC) for assessing usefulness of new predictive measures • C-statistic • Measures overall test/model accuracy (sensitivity/specificity) • A weighted average of sensitivity over all possible cut-points • Weighted by pdf of non-events • High sensitivities (low cut-points) have high weights • Probability Interpretation:the probability of assigning a greater risk to a randomly selected patient with the event compared with a randomly selected patient without the event. • P(pevent> pnon-event) for random pair
Receiver Operating Curve (ROC) Predicted p True positive rate False positive rate ∆ C-statistic Interpretation:Increase in probability that a random event subject will have a higher predicted p than a random non-event subject. Usually small after a few good predictors included in the model
New Risk reclassification measures • Clinicians want to know whether an added predictor will change risk such that they should treat patients differently • Can we better quantify improvement in risk prediction from new biomarkers? • Net Reclassification Improvement (NRI) • Integrated Discrimination Improvement (IDI) • Pencina, Agostino et al., Statist. Med. 2008; 27:157-172. • How do they differ from the C-statistic? • How and when should we be using them?
Net Reclassification Improvement • NRI can be calculated as a sum of two separate components: one for individuals with events and the other for individuals without events • For events, assign 1 for upward reclassification, -1 for downward and 0 for people who do not change their risk category • The opposite is done for non-events • Sum the individual scores and divide by numbers of people in each group
Category-free NRI • Calculate p1 and p2 (Old model=p1 New model=p2) • Event NRI = P(up l event) – P(down l event) • Non-event NRI = P(down l nonevent) – P(up l nonevent) • NRI= Event NRI+Non-event NRI (Pencina 2008) Or • ½ NRI (Pencina 2010) Or • ½ wNRI (Pencina 2010)
Integrated Discrimination Improvement (IDI) • Absolute IDI: Probability difference in discrimination slopes (mean difference in p between events and non-events). = (p2E - p2NE) - (p1E - p1NE) = (p2E - p1E) - (p2NE - p1NE) • Relative IDI = (p2E - p2NE)/(p1E - p1NE)
Recent example JACC 2011; 58(10): 1025-33. August 2011
NRI Am J Epidemiology 174 (5); June 27, 2011
Stratified versus Unstratified NRI Stratified NRI Q1 Q2 Q3 Q4 nonCases Q1 Q2 Q3 Q4 Cases Noncases Cases 0.085 0.088 0.003 0.055 0.053 -0.002 -0.01 (0.016) 0.72 Unstratified NRI Statistical testing: Z-score for discordance ~ McNemar’s test.
Predicting length of hospital stay • Short-stay wards necessary due to bed shortages in specialist wards • But incorrectly assign patients to short-stay • Would overfill short stay units • Prevent correct treatment for long stay patients • Clinicians trained to diagnose and treat not to predict length of stay • Few variables beyond age appear informative
Dataset • 3 major hospitals • FMC • RGH • Auckland • N=1457 General medical patients • Complete data on: • Age • SBP • HR • RR • Mobility • WBC count • Cardiac failure (CF) • Need for supplementary oxygen (SuO2) • All previously collected for predicting outcome • Modified Early Warning Score (MEWS) • Used by Emergency Medical Services to quickly determine risk of death • SBP • HR • RR • Temperature
Statistical Analysis • Logistic regression model for predicting p: P(long stay) • Scaling using 2 STATA commands: • lintrend (Joanne Garrett – Univ North Carolina) • fracpoly (Patrick Royston) • Calibration – HL-deciles and LR tests • Measures of Discrimination • C-statistic • IDI • Category-dependent NRI • 50% cut-off • 57% cut-off • Category free NRI
STATA lintrend command – log odds age lintrend longstay age, round(10) plot(log) xlab ylab
STATA lintrend command – log odds WBC count lintrend longstay wbc, round(1) plot(log) xlab ylab
Fracpoly WBC . fracpoly logistic longstay wbc, table compare ........ -> gen double Iwbc__1 = X^.5-.9876731667 if e(sample) -> gen double Iwbc__2 = X^.5*ln(X)+.0245010876 if e(sample) (where: X = wbc/10) Logistic regression Number of obs = 1457 LR chi2(2) = 49.38 Prob > chi2 = 0.0000 Log likelihood = -971.8662 Pseudo R2 = 0.0248 ------------------------------------------------------------------------------ longstay | Odds Ratio Std. Err. z P>|z| [95% Conf. Interval] -------------+---------------------------------------------------------------- Iwbc__1 | .0040704 .0076682 -2.92 0.003 .0001014 .1633818 Iwbc__2 | 34.78284 33.17947 3.72 0.000 5.362915 225.5948 ------------------------------------------------------------------------------ Deviance: 1943.73. Best powers of wbc among 44 models fit: .5 .5. Fractional polynomial model comparisons: --------------------------------------------------------------- wbc df Deviance Dev. dif. P (*) Powers --------------------------------------------------------------- Not in model 0 1993.113 49.380 0.000 Linear 1 1954.819 11.087 0.011 1 m = 1 2 1949.234 5.502 0.064 2 m = 2 4 1943.732 -- -- .5 .5 --------------------------------------------------------------- (*) P-value from deviance difference comparing reported model with m = 2 model
Calibration number of observations = 1457 number of groups = 10 Hosmer-Lemeshow chi2(8) = 14.66 Prob > chi2 = 0.07 number of observations = 1457 number of groups = 5 Hosmer-Lemeshow chi2(3) = 5.64 Prob > chi2 = 0.13 number of observations = 1457 number of covariate patterns = 1457 Pearson chi2(1445) = 1486.69 Prob > chi2 = 0.22
C-statistic #Compare Age with Age + Heart rate using “roccomp” quietly logistic longstay age predict p1 if e(sample),p quietly logistic longstay c.age##c.hrby10 predict p2 if e(sample),p roccomp longstay p1 p2 ROC -Asymptotic Normal-- Obs Area Std. Err. [95% Conf. Interval] ------------------------------------------------------------------------- p1 1457 0.7167 0.0136 0.69000 0.74338 p2 1457 0.7433 0.0131 0.71767 0.76897 ------------------------------------------------------------------------- Ho: area(p1) = area(p2) chi2(1) = 15.68 Prob>chi2 = 0.0001
ROC curves Age Area ROC=0.717 Age + heart rate Area ROC=0.743 ^ ^ • P(pevent> pnon-event) for random pair ~ 2.5%
Sensitivity and Specificity Improved sensitivity only at high cut-points. C-statistic weights large sensitivities more heavily May be why improvements in sensitivities with later predictors don’t translate to increased C.
Predicted probabilities Distribution of probabilities shift lower Distribution of probabilities flatten
STATA NRI command User written – Author Liisa Byberg, Department of Surgical Sciences, Orthopedics unit, and Uppsala Clinical Research Center, Uppsala University, Sweden type net from http://www.ucr.uu.se/sv/images/stories/downloads Syntax nri1 depvar varlist1, prvars(varlist2) cut(#) nri2 depvar varlist1, prvars(varlist2) cut(# #) nri3 depvar varlist1, prvars(varlist2) cut(# # #)
nri1 – heart rate (probability cut-point=50) nri1 longstay age,prvars(hrby10 agehrby10) cut(50) ------------------------------------------------------------------ NRI | Estimate Std. Err. Z P-value ----------+------------------------------------------------------- | 0.05170 0.01792 2.88484 0.00392 ------------------------------------------------------------------ ------------------------------- longstay | and | Established risk Establish | factors + new ed risk | predictors factors | <50% >=50% Total ----------+-------------------- 1 | <50% | 108 63 171 >=50% | 36 620 656 | Total | 144 683 827 ----------+-------------------- 0 | <50% | 294 29 323 >=50% | 41 266 307 | Total | 335 295 630 ------------------------------- reclassified Upward-Downward (%) reclassified Downward (%) reclassified Upward (%) NRI P-value 36/827 (0.0435) 63/827 (0.0762) (0.0327) 41/630 (0.0650) 29/630 (0.0460) (-0.0190) 0.0517 0.004 SE=√ ((0.0762+0.0435)/827 + (0.0460+0.0651)/630)=0.0179 z=0.0517/0.0179=2.88 (McNemar – asymptotic test for correlated proportions)
STATA IDI command syntax idi depvarvarlist1,prvars(varlist2) idi longstay age,prvars(hrby10 agehrby10) ---------------------------------------------------- IDI | Estimate Std. Err. P-value ----------+----------------------------------------- | 0.04195 0.00525 0.00000 ---------------------------------------------------- Definition: IDI= (IS2 – IS1) – (IP2 – IP1) IDI = (p2-p1)events - (p2-p1)non-events IS = ∫ sensitivity IP = ∫ (1 – specificity)
Predicted probabilities and the IDI IDI interpretation: Improvement in average sensitivity plus any potential decrease in average (1-specificty). Magnitude is hard to interpret. Some studies also present relative IDI (%).
HR Mobility BP WBC RR CCF Supp_O2 IDI C-Statistic
HR Mobility BP WBC RR CCF Supp_O2 NRI57 NRI50 Effect of each variable on re-classification depends on the classification cut-point Small changes in chosen cut-point can have large influences
HR Mobility BP WBC RR CCF Supp_O2 Overall Category-free NRI Interpretation: proportion of subjects with movement of p in the correct direction – averaged for event and non-event subjects.
HR Mobility BP WBC RR CCF Supp_O2 Category-free Event NRI Category-free Non-Event NRI Interpretation: Net movement of p’s in the correctdirection - for event and non-event subjects separately. Pr(p is higher-p is lower) → mostly poorer re-classification Pr(p is lower- p is higher) → consistently improved re-classification
Proportion of long-stay whose p went up Proportion of short-stay whose p went down Consistently > 50% with each new variable Mostly < 50% with each new variable HR Mobility BP WBC RR CCF Supp_O2
Summary • IDI • Mirrored the C-statistic but was more sensitive. • Equally weights sensitivity across cut-points. • C-statistic weights large sensitivities more heavily. • Category-dependent NRI • The variables selected were heavily dependent on the chosen cut-points • Fewer variables identified as important discriminators than for either the C-statistic, the IDI or category-free NRI. • Category-free NRI • Overall, quite similar results to the C-statistic and IDI • Very different performances amongst the short-stay and long-stay patients
Conclusions • Discrimination statistics cannot be used interchangeably • May be necessary to present all 4 for greatest insight. • C-statistic: Averaged sensitivity • Does not weight equally across cut-points • Does not assess risk re-classification. • IDI: Averaged sensitivity • Weights cut-points equally • Adjusts for specificity differently to C-statistic • May better highlight potentially important predictors. • Category-free NRI: % subjects with correct movement in p. • Event and non-event NRI may perform quite differently • Category-dependent NRI: % correct movement across categories. • Results may be heavily influenced by chosen cut-points. • Be wary of studies using the category-dependent NRI with non predefined cut-points.