Download
1 / 16
160 likes | 209 Views
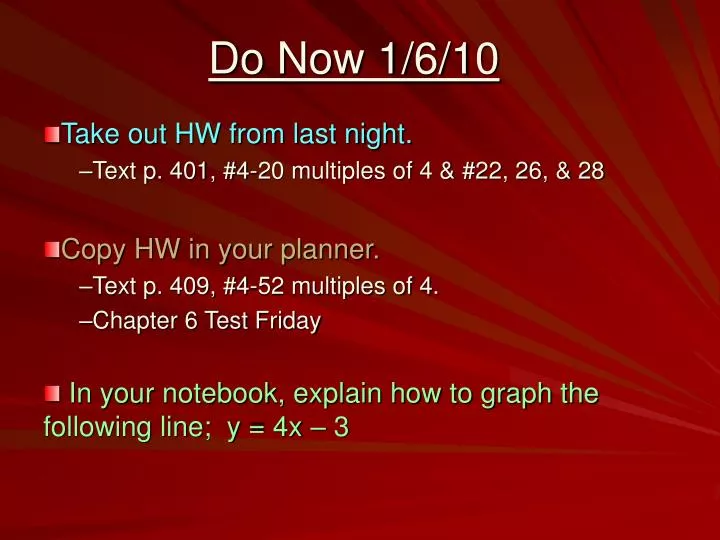
Do Now 1/6/10. Take out HW from last night. Text p. 401, #4-20 multiples of 4 & #22, 26, & 28 Copy HW in your planner. Text p. 409, #4-52 multiples of 4. Chapter 6 Test Friday In your notebook, explain how to graph the following line; y = 4x – 3. 4) y ≤ -3 or y ≥ 3 8) j ≤ -1¾ or y ≥ 1¾

E N D
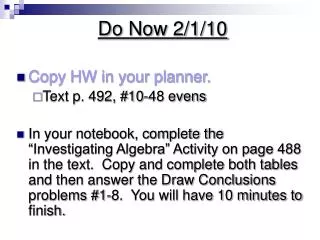
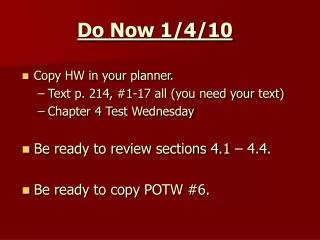
Do Now 1/6/10 • Take out HW from last night. • Text p. 401, #4-20 multiples of 4 & #22, 26, & 28 • Copy HW in your planner. • Text p. 409, #4-52 multiples of 4. • Chapter 6 Test Friday • In your notebook, explain how to graph the following line; y = 4x – 3
4) y ≤ -3 or y ≥ 3 8) j≤ -1¾ or y ≥ 1¾ 12) 3 < s < 4 16) s < -3 or s > 13½ 20) f ≤ -12 or y ≥ 9 22) AND is for <, ≤; OR is for >, ≥ 26) |2x + 7| ≥ 15; x ≤ -11 or x ≥ 4 28) 4|x – 9| < 8; 7 < x < 11 Homework Text p. 401, #4-20 multiples of 4; #22, 26, & 28
Objective • SWBAT graph linear equations and linear inequalities in two variables
Section 6.7 “Graph Linear Inequalities” Linear Inequalities- the result of replacing the = sign in a linear equation with an inequality sign.
Linear Inequalities An example of a linear inequality in two variables is x - 3y ≤ 6. The solution of an inequality in two variables, x and y, is an ordered pair (x, y) that produces a true statement when substituted into the inequality. Which ordered pair is NOT a solution of x - 3y ≤ 6? A. (0,0) B. (6,-1) C. (10, 3) D. (-1,2) Substitute each point into the inequality. If the statement is true then it is a solution. True, therefore (0,0) is a solution. x - 3y ≤ 6 (0) – 3(0) ≤ 6
Graph an Inequality in Two Variables • The graph of an inequality in two variables is the set of points that represent all solutions of the inequality. • The BOUNDARY LINE of a linear inequality divides the coordinate plane into two HALF-PLANES. Only one half-plane contains the points that represent the solutions to the inequality.
Graphing Linear Inequalities • Graphing Boundary Lines: • Use a dashed line for < or >. • Use a solid line for ≤ or ≥.
Graph an Inequality Graph the inequality y > 4x - 3. STEP2 STEP3 STEP1 Graph the equation Test (0,0) in the original inequality. Shade the half-plane that contains the point (0,0), because (0,0) is a solution to the inequality.
Graph an Inequality Graph the inequality x + 2y ≤ 0. STEP2 STEP3 STEP1 Shade the half-plane that does not contain the point (1,0), because (1,0) is not a solution to the inequality. Graph the equation Test (1,0) in the original inequality.
Graph an Inequality Graph the inequality x + 3y ≥ -1. STEP2 STEP3 STEP1 Shade the half-plane that contains the point (1,0), because (1,0) is a solution to the inequality. Graph the equation Test (1,0) in the original inequality.
Graph an Inequality Graph the inequality y ≥ -3. STEP2 STEP3 STEP1 Shade the half-plane that contains the point (2,0), because (2,0) is a solution to the inequality. Graph the equation Test (2,0) in the original inequality. Use only the y-coordinate, because the inequality does not have a x-variable.
Graph an Inequality Graph the inequality x≤ -1. STEP2 STEP3 STEP1 Shade the half-plane that does not contain the point (3,0), because (3,0) is not a solution to the inequality. Graph the equation Test (3,0) in the original inequality. Use only the y-coordinate, because the inequality does not have a x-variable.
Challenge“Can You Write and Graph the Mystery Inequality???” • The points (2,5) and (-3, -5) lie on the boundary line. The points (6,5) and (-2, -3) are solutions of the inequality. y ≤ 2x + 1
Graph Absolute Value FunctionsExtension Activity 6.5 ABSOLUTE VALUE FUNCTION- g(x) = |x -3| f(x) = |x| g(x) = |x - 3| f(x) = |x|
Graph Absolute Value FunctionsExtension Activity 6.5 • Read pages 396-397. Complete #1-7 on page 397. Make sure to graph and compare each function to f(x) = |x|.
Homework Text p. 409, #4-52 multiples of 4