Download

1 / 59
620 likes | 1.03k Views
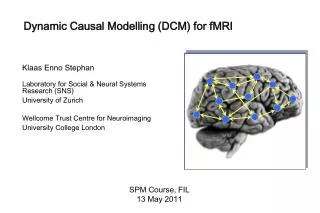
Rosalyn Moran Virginia Tech Carilion Research Institute Department of Electrical & Computer Engineering, Virginia Tech. Dynamic Causal Modelling for fMRI . ION Short Co urse, 1 5 th – 17 th May 2014. Dynamic Causal Modelling.

E N D
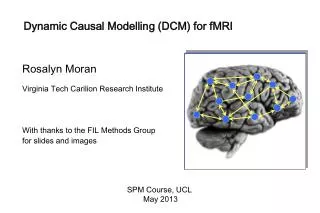
Rosalyn Moran Virginia Tech Carilion Research Institute Department of Electrical & Computer Engineering, Virginia Tech Dynamic Causal Modelling for fMRI ION Short Course, 15th – 17th May 2014
Dynamic Causal Modelling DCM framework was introduced in 2003 for fMRI by Karl Friston, Lee Harrison and Will Penny (NeuroImage 19:1273-1302) part of the SPM software package >300 papers published
Overview • Dynamic causal models (DCMs) • Basic idea • Neural level • Hemodynamic level • Parameter estimation, priors & inference • Applications of DCM to fMRI data • Attention to motion in the visual system • Modellingsynesthesia • The Status Quo Bias
Overview • Dynamic causal models (DCMs) • Basic idea • Neural level • Hemodynamic level • Parameter estimation, priors & inference • Applications of DCM to fMRI data • Attention to motion in the visual system • Modelling synesthesia • The Status Quo Bias
Principles of organisation: complementary approaches Functional Specialisation Functional Integration
Structural, functional & effective connectivity Sporns 2007, Scholarpedia Mechanism - free Mechanistic anatomical/structural connectivitypresence of axonal connections functional connectivity statistical dependencies between regional time series effective connectivity causal (directed) influences between neurons or neuronal populations
Functional vs Effective Connectivity • Functional connectivity is defined in terms of statistical dependencies: an operational concept that underlies the detection of a functional connection, without any commitment to how that connection was caused • Assessing mutual information & testing for significant departures from zero • Simple assessment: patterns of correlations • Undirected or Directed Functional Connectivity eg. Granger Connectivity • Effective connectivity is defined at the level of hidden neuronal states generating measurements. Effective connectivity is always directed and rests on an explicit (parameterised) model of causal influences — usually expressed in terms of difference (discrete time) or differential (continuous time) equations. • DCM • SEM
Dynamic Causal Modelling (DCM) Hemodynamicforward model:neural activityBOLD Electromagnetic forward model:neural activityEEGMEG LFP Neural state equation: fMRI EEG/MEG simple neuronal model complicated forward model complicated neuronal model simple forward model
Dynamic Causal Modelling DCM is not intended for ‘modelling’ DCM is an analysis framework for empirical data DCM does not describe a time series DCM uses a times series to test mechanistic hypotheses Hypotheses are constrained by the underlying dynamic generative (biological) model Time Series Friston et al 2003; Stephan et al 2008 Kiebel et al, 2006; Garrido et al, 2007 David et al, 2006; Moran et al, 2007
Deterministic DCM for fMRI y y H{2} x2 H{1} A(2,2) A(2,1) u1 B(1,2) A(1,2) x1 u2 C(1) A(1,1)
Overview • Dynamic causal models (DCMs) • Basic idea • Neural level • Hemodynamic level • Parameter estimation, priors & inference • Applications of DCM to fMRI data • Attention to motion in the visual system • Modelling synesthesia • The Status Quo Bias
Neuronal model System states xt x1 x2 x3 Inputs ut Connectivity parameters θ • State changes are dependent on: • the current state x • external inputs u • its connectivity θ Aim: model temporal evolution of a set of neuronal states xt
Example: a linear model of interacting visual regions Visual input in the visual field - left (LVF) - right (RVF) LG = lingualgyrus FG = fusiform gyrus FG right FG left x4 x3 LG right LG left x1 x2 u1 RVF LVF u2
Example: a linear model of interacting visual regions Visual input in the visual field - left (LVF) - right (RVF) LG = lingualgyrus FG = fusiform gyrus FG right FG left x4 x3 LG right LG left x1 x2 u1 RVF LVF u2
Example: a linear model of interacting visual regions Visual input in the visual field - left (LVF) - right (RVF) LG = lingualgyrus FG = fusiform gyrus FG right FG left x4 x3 LG right LG left x1 x2 u1 RVF LVF u2 systemstate input parameters state changes effective connectivity externalinputs
Example: a linear model of interacting visual regions FG right FG left x4 x3 LG right LG left x1 x2 u1 RVF LVF u2 ATTENTION u3
Deterministic Bilinear DCM driving input Simply a two-dimensional taylorexpansion(around x0=0, u0=0): modulation Bilinear stateequation:
DCM parameters = rate constant x1 Decay function 1 0.8 A B 0.6 If AB is 0.10 s-1 this means that, per unit time, the increase in activity in B corresponds to 10% of the current activity in A 0.4 0.10 0.2 0 -0.1 0 0.1 0.2 0.3 0.4 0.5 0.6 0.7 0.8 0.9
Example: context-dependent enhancement u1 stimulus u1 u2 context u2 x1 x1 x2 x2
DCM for fMRI: the full picture Neural state equation modulatory input u2(t) endogenous connectivity driving input u1(t) t modulation of connectivity direct inputs t y BOLD y y y λ hemodynamic model activity z2(t) activity z3(t) activity z1(t) z Neuronal states integration Stephan & Friston (2007), Handbook of Brain Connectivity
Overview • Dynamic causal models (DCMs) • Basic idea • Neural level • Hemodynamic level • Parameter estimation, priors & inference • Applications of DCM to fMRI data • Attention to motion in the visual system • Modelling synesthesia • The Status-Quo Bias
DCM: Neuronal and hemodynamic level x λ y • Cognitive system is modelled at its underlying neuronal level (not directly accessible for fMRI). • The modelled neuronal dynamics (x) are transformed into area-specific BOLD signals (y) by a hemodynamicmodel (λ). • Overcomes regional variability at the hemodynamic level • DCM not based on temporal precedence at measurement level
DCM: Neuronal and hemodynamic level x λ y “Connectivity analysis applied directly on fMRI signals failed because hemodynamics varied between regions, rendering temporal precedence irrelevant” ….The neural driver was identified using DCM, where these effects are accounted for…
The hemodynamic “Balloon” model 3 hemodynamic parameters Region-specific HRFs Important for model fitting, but of no interest
Hemodynamic model u1 u2 y1 z1 y2 z2 y represents the simulated observation of the bold response, including noise, i.e. y = h(u,θ)+e BOLD (with noise added) BOLD (with noise added) Z: neuronal activity Y: BOLD response
How independent are neural and hemodynamic parameter estimates? A B C h ε Stephan et al. (2007) NeuroImage
Overview • Dynamic causal models (DCMs) • Basic idea • Neural level • Hemodynamic level • Parameter estimation, priors & inference • Applications of DCM to fMRI data • Attention to motion in the visual system • Modelling synesthesia • The Status-Quo Bias
DCM is a Bayesian approach new data prior knowledge posterior likelihood ∙ prior parameter estimates Bayes theorem allows one to formally incorporate prior knowledge into computing statistical probabilities. Priors in DCM: empirical, principled & shrinkage priors The “posterior” probability of the parameters given the data is an optimal combination of prior knowledge and new data, weighted by their relative precision.
Parameter estimation: Bayesian inversion u1 u2 y1 z1 y2 z2 Estimate neural & hemodynamic parameters such that the MODELLED and MEASURED BOLD signals are similar (model evidence is optimised), using variationalEM under Laplace approximation ... What?
VB in a nutshell (mean-field approximation) Neg. free-energy approx. to model evidence. Mean field approx. Maximise neg. free energy wrt. q = minimise divergence, by maximisingvariational energies Iterative updating of sufficient statistics of approx. posteriors by gradient ascent.
Bayesian inversion ηθ|y Specify generative forward model (with prior distributions of parameters) Regional responses Variational Expectation-Maximization algorithm Iterative procedure: • Compute model response using current set of parameters • Compare model response with data • Improve parameters, if possible • Gaussian posterior distributions of parameters • Model evidence
Inference about DCM parameters: Bayesian single subject analysis Gaussian assumptions about the posterior distributions of the parameters posterior probability that a certain parameter (or contrast of parameters) is above a chosen threshold γ: By default, γ is chosen as zero – the prior ("does the effect exist?").
Inference about DCM parameters: Bayesian parameter averaging group posterior covariance individual posterior covariances group posterior mean individual posterior covariances and means FFX group analysis Likelihood distributions from different subjects are independent Under Gaussian assumptions, this is easy to compute Simply ‘weigh’ each subject’s contribution by your certainty of the parameter
Inference about DCM parameters: RFX analysis (frequentist) Separate fitting of identical models for each subject Selection of parameters of interest one-sample t-test:parameter > 0 ? paired t-test:parameter 1 > parameter 2 ? rmANOVA:e.g. in case of multiple sessions per subject Analogous to ‘random effects’ analyses in SPM, 2nd level analyses can be applied to DCM parameters
Inference about models: Bayesian model comparison Fixed Effects Model selection via log Group Bayes factor: accounts for both accuracy and complexity of the model allows for inference about structure (generalisability) of the model Random Effects Model selection via Model probability: Prior / instead of to inference on parameters Which of various mechanisms / models best explains my data Use model evidence
Bayes factors For a given dataset, to compare two models, we compare their evidences. Kass & Raftery 1995, J. Am. Stat. Assoc. Kass & Raftery classification: or their log evidences Ketamine modulates: All extrinsic connections, Intrinsic NMDA and Inhibitory / Modulatory processes (one of the red arrows) : use log bayes factors
u1 u2 y1 z1 y2 z2 Bayesian Model Comparison The model goodness: Negative Free Energy Accuracy - Complexity • The complexitytermofFishigher • themoreindependentthepriorparameters ( effective DFs) • themoredependenttheposteriorparameters • themoretheposteriormeandeviatesfromthepriormean
Overview • Dynamic causal models (DCMs) • Basic idea • Neural level • Hemodynamic level • Parameter estimation, priors & inference • Applications of DCM to fMRI data • Attention to motion in the visual system • Modelling synesthesia • The Status-Quo Bias
Example 1: Attention to motion Friston et al. (2003) NeuroImage
Bayesian model selection models marginal likelihood m1 m2 m3 m4 Modulation By attention Modulation By attention Modulation By attention Modulation By attention PPC PPC PPC PPC External stim stim V1 stim V1 stim V1 V1 V5 V5 V5 V5 attention 0.10 PPC 0.39 0.26 1.25 0.26 stim V1 V5 0.13 estimated effective synaptic strengths for best model (m4) 0.46 Stephan et al. 2008, NeuroImage
Parameter inference attention MAP = 1.25 0.10 PPC 0.26 1.25 0.39 0.26 V1 stim 0.13 V5 0.46 0.50 motion Stephan et al. 2008, NeuroImage
Data fits motion & attention static dots motion & no attention V1 V5 PPC observed fitted
Example 2: Brain Connectivity in Synesthesia Hubbard, 2007 Can changes in effective connectivity explain synesthesia activity in V4? • Specific sensory stimuli lead to unusual, additional experiences • Grapheme-color synesthesia: color • Involuntary, automatic; stable over time, prevalence ~4% • Potential cause: aberrant cross-activation between brain areas • grapheme encoding area • color area V4 • superior parietal lobule (SPL)
Relative model evidence predicts sensory experience Van Leeuwen, den Ouden, Hagoort (2011) JNeurosci
Example 3: The Status-Quo Bias Decision Accept Reject Difficulty Low High Fleming et al PNAS 2010
Example 3: The Status-Quo Bias Decision Accept Reject Difficulty Low High Main effect of difficulty in medial frontal and right inferior frontal cortex Fleming et al PNAS 2010
Example 3: The Status-Quo Bias Decision Accept Reject Difficulty Low High Interaction of decision and difficulty in region of subthalamicnucleus: Greater activity in STN when default is rejected in difficult trials Fleming et al PNAS 2010
Example 3: The Status-Quo Bias DCM: “aim was to establish a possible mechanistic explanation for the interaction effect seen in the STN. Whether rejecting the default option is reflected in a modulation of connection strength from rIFC to STN, from MFC to STN, or both “… MFC rIFC STN Fleming et al PNAS 2010
Example 3: The Status-Quo Bias Difficulty Difficulty Difficulty Difficulty Difficulty Difficulty MFC Difficulty MFC Difficulty MFC rIFC rIFC MFC MFC MFC MFC rIFC MFC MFC Difficulty Difficulty Difficulty Difficulty Reject STN STN STN Reject Reject rIFC rIFC rIFC rIFC rIFC rIFC Reject Reject Reject Reject Reject Reject STN STN STN STN STN STN Reject Reject Reject
Example 3: The Status-Quo Bias Difficulty Difficulty MFC MFC Difficulty Difficulty MFC rIFC rIFC rIFC Reject Reject Reject STN STN STN Difficulty Difficulty Difficulty MFC MFC Difficulty MFC rIFC rIFC rIFC Reject STN STN STN Reject Reject Difficulty Difficulty MFC Difficulty MFC MFC Difficulty rIFC rIFC rIFC Reject Reject Reject STN Reject STN Reject Reject STN