Download
1 / 31
310 likes | 386 Views
Pediatric Pedestrian Injuries in NYC and Safe Routes to School. Charles DiMaggio, PhD, MPH, PA-C Associate Professor Departments of Anesthesiology and Epidemiology Research Director Center for Injury Epidemiology and Control Columbia University, NY. Acknowledgements.

E N D
Pediatric Pedestrian Injuries in NYC and Safe Routes to School Charles DiMaggio, PhD, MPH, PA-C Associate ProfessorDepartments of Anesthesiology and Epidemiology Research Director Center for Injury Epidemiology and Control Columbia University, NY
Acknowledgements • Centers for Disease Control and Prevention 1 R21 CE001816 and 1 R49 CE002096 • New York City Department of Transportation • Guohua Li, Peter Meunnig, QixuanChen, Maureen Durkin, Lynne Richardson
Some Conclusions • Traffic Calming Works • Evaluation Important • Kids can still be kids and be safe
Overview • Pediatric Pedestrian Injury • NYC Experience in late 1990s and role of vehicles type • Safe Routes to School Program in NYC
Pediatric Pedestrian Injury in the US • 25% of pediatric mvc deaths are pedestrian (vs. 5-10% adults) • leading cause of TBI in kids • about half all injury-related pediatric hospital admissions each year • 579,621 ED visits 1- 19 y/o 2001-2010 • 8,651 deaths • 23% psych sequellae • Decreased activity, obesity
Pedestrian Injury in NYC • 1572 total fatalities 2004-2008 (~300 per year)* • 35% decrease since 2001 • 3.5 fatalities per 10,000 population (lower than Copenhagen) • 168,000 total injuries over recent 10 years, or ~ 16,800 per year * New York City Pedestrian Safety Study and Action Plan, 2010
Pediatric Pedestrian Risk in the 1990s • NYC DOT Compiled NYPD Police Crash Reports • MV104AN • 700,000 MVCs NYC 1991-1997; 1.5 million vehicles; 900,000 injured; 100,000 pedestrians • 27,377 crashes involving ages 5-19 • 149 Fatalities (54 per 10,000) • 18,117 (66%) vehicle information (VIN) • Analysis • 5-9, 10-14, 15-19 • Frequencies, Odds Ratios Association Fatality • Logistic regression LTV (exposure) fatality (outcome) • Covariates: driver age, driver gender, vehicle weight
Pediatric Pedestrian Risk in the 1990s • Yearly Injury Rate 1991-1997, 5-19 y/o’s: 246/100,000 • Males, 9 y/o, weekdays, summer • Younger than 10 years: • 22.6% increase population • 41.5% decrease injury rate • Stable CFR (<1%)
The Role of Vehicle Type • Association with Fatality (Univariate) • Driver age < 25: OR = 2.0 (95% CI 1.2, 3.1) • Male driver : OR = 2.2 (95% CI 1.1, 4.3) • Head Injury: OR = 2.5 (95% CI 1.6, 3.7) • Light Trucks and Vans* • 5-19 y/o OR - 2.5 (95% CI 1.6, 3.8) • 5-9 y/o OR - 4.2 (95% CI 1.9, 9.5) • 10-14 y/o - 1.0 (0.3, 2.9) • 15-19 y/o - 2.5 (1.0, 6.5) * Logistic Regression Controlling for Driver Age and Gender, Vehicle Weight *Regression model controlling for driver age, gender, road surface condition, vehicle weight, head injury
Interaction TBI with LTV? • Younger kids had more head injuries • OR for 5-9 y/o = 1.6 (95% CI 1.5, 1.7) • But this association did not differ by vehicle type • LTV OR =1.7 (1.4,2.0) Car OR=1.6 (1.5,1.7) • Head injuries associated with fatality for all kids: OR 5-19 y/o=2.3 (95% CI 1.6,3.4) • But as likely to result in fatality in any age • 5-9 y/o OR = 2.5 (1.3, 4.9), 10-19 y/o OR=2.3 (1.4, 3.7) • As likely to result in fatality in both body types: • LTV OR=2.5 (1.2,4.9) Cars OR=2.4 (1.4,3.9)
LTVs more likely to strike younger children? • Theoretically Plausible • carriage height + pedestrian height = visual obstruction • Not Supported by Data • Association LTV + Age: 5-9 y/o OR=1.2 (1.1, 1.4), 10-19 y/o OR=1.1 (1.0, 1.3) • Physics • Speed • F=mv2/2 • child hit by vehicle at 30 mph 50% survival • 18 mph, 90% survival
Some Conclusions • Declines in pediatric pedestrian injury in NYC • implications for activity? • Ian Roberts “Why have child pedestrian injury rates fallen?”, BMJ, 1993 • LTVsare associated with fatal pediatric pedestrian injuries • Association Mostly due to Youngest Pedestrians • Measurement Error • Head Injury
Next steps? • Large routinely collected administrative databases are useful epidemiologic tools • advances in computing • advances in analysis • Possible Interventions: ”New York Model” (Susan Standfast, MD) • engineering, enforcement, education • evaluation, environment, EMS…
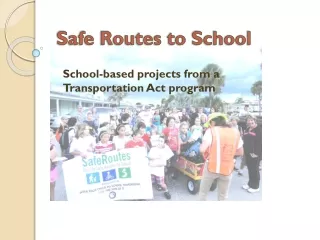
Safe Routes to School • 2005 US DOT legislation $612 million • by 2012, total about $1.12 billion • 10,000 of nation’s 100,000 schools • get kids walking / biking (safely) to school • 130 of 2,000 NYC schools • Traffic and pedestrian signals, exclusive pedestrian crossing times, speed bumps, speed boards, sidewalk extensions; ~ 700 ft. buffer
Traffic Calming • reduce pedestrian injuries by slowing traffic, ceding rights to pedestrians, and providing disincentives for driving • road narrowings, • new traffic and pedestrian signals, • timed crossings that allow pedestrians to cross before cars, • speed bumps, • speed boards (radar-equipped digital signs that tell drivers how fast they are moving), • high visibility crosswalks • new parking regulations
NYC SRTS Evaluation Program • Data and Analysis • 186,000 geocoded pedestrian crashes 2001-2010 • Geocoded school centroids • Census tract injury counts • Mon-Fri, 7AM-9AM or 2PM-4PM (excluding Summer, Holidays) • Compare SRTS census tracts vs non-SRTS census tracts pre and post program implementation (2008)
Results • 44% decrease (95% CI 17%,65%) in SRTS census tracts following program implementation • 0% change (95% CI -8%, 8%) in non-SRTS census tracts following program implementation
Graphical Assessment School-Aged Pedestrian Crashes per 10,000 Population During Travel To-From School Hours, SRTS Intervention Census Tracts (Yes) vs. Non-Intervention Census Tracts (No), New York City 2001-2010
Changepoint Analysis most likely changepoint SRTS census tracts 2nd quarter 2008 (quarter 30.5, 95% Cr I 30, 31) non-SRTS census tracts largely unchanged
Difference in Differences Analysis log(t) = 0 + 1 Periodt + 2 SRTS + 3Periodt*SRTS + log(Populationt) • 44% risk reduction (95% CI 87% decrease, 130% increase) • compared to incomplete SRTS: 32% risk reduction (95% CI 74% decrease, 78% increase)
Cost Benefit / Effectiveness • Markov model long-term impacts SRTS on injury reduction • savings medical costs, disability, death • overall net societal benefit $230 million, 2,055 QALYs NYC • $9.2 million, 1,638 QALYs school-aged pedestrians • much of cost benefit from reduced school-bus use Muennig P, Epstein M, Li G and DiMaggio C
Next Steps • New York City • Spatial Temporal Analysis • Transportation Alternatives – Speed Cameras • Texas, New York State, California • County-Level Data • Individual States and Multilevel Modeling • National Analysis • US Department of Transportation SDS • Individual States • Arkansas, Iowa, Kansas, Kentucky, Maryland, Michigan, Minnesota, Missouri, Montana, Nebraska, New Mexico, Ohio, Pennsylvania, South Carolina, Virginia, Washington, Wyoming,
Some Conclusions about SRTS • Traffic Calming Works • expensive, but we can rationally and effectively use public resources to address public health and safety • education and enforcement still important • Evaluation Important • MAP-21 removes SRTS as stand-alone program • difficult to tease out effects of any single program • 1500 pedestrian signals, re-engineered 60 miles of streets, 20 MPH pedestrian safety zones • NYC experience unique? • Kids can still be kids and be safe