Download
1 / 44
480 likes | 2.42k Views
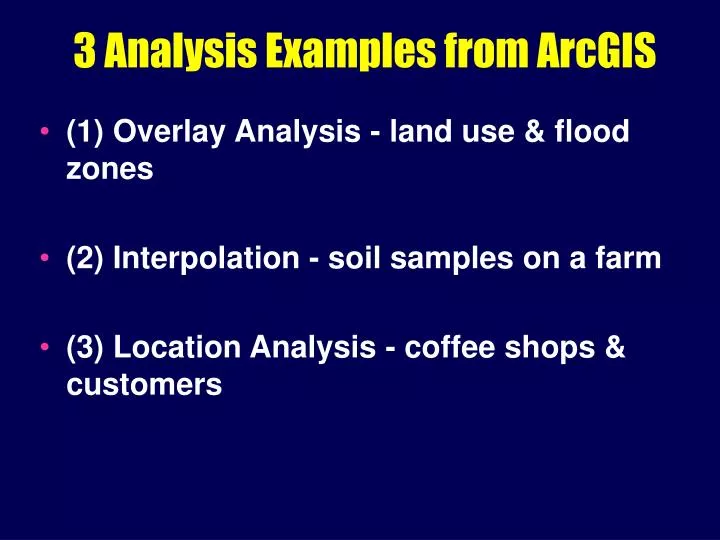
3 Analysis Examples from ArcGIS (1) Overlay Analysis - land use & flood zones (2) Interpolation - soil samples on a farm (3) Location Analysis - coffee shops & customers Residential Parcels Susceptible to Flooding Insurance Co.

E N D
3 Analysis Examples from ArcGIS • (1) Overlay Analysis - land use & flood zones • (2) Interpolation - soil samples on a farm • (3) Location Analysis - coffee shops & customers
create a statistical summary table to report the amount of each land use type inside the flood zone area
Which land use types are in the flood zone? Which one has the greatest area in the flood zone? Which land use type is most likely to contain homes?
Residential areas in flood zoneBUTneed spatial analysis to pinpoint locations Flowchart (GIS Analysis Model)
Query land use to create new layer w/only residential [Land use] == 3
Next, query flood zone & new residential layer to get “Wet homes”Simple Overlay [Flood zone] & [Residential]
Result: areas that are residential and in flood zone ( values of 1 )
"a set of methods whose results change when the locations of the objects being analyzed change" • (1) Overlay Analysis - land use & flood zones • (2) Interpolation - soil samples on a farm • (3) Location Analysis - coffee shops & customers
Interpolate samples, then query to find pH > 7Farmer needs to treat these areas w/ammonium sulfate Flowchart (GIS Analysis Model)
pH surface [pH surface] > 7 Instead of hillshade, use raster calculator again
Result: areas that farmer should treat w/ammonium sulfate to lower the pH to 7 so that soil is balanced
The Farm • Size = ~5.35 acres (233,046 sq ft. or 21,650 sq m) • Combined size of new treatment areas = ~0.145 acres (6,338 sq ft or 588 sq m) • Ammonium sulfate @ $50.00 per acre • Treat whole field - $267.50 • Treat only where needed - $7.25 • Crop yield and treatment maps over time
"a set of methods whose results change when the locations of the objects being analyzed change" • (1) Overlay Analysis - land use & flood zones • (2) Interpolation - soil samples on a farm • (3) Location Analysis - coffee shops & customers
Best location for new Beanery w/ location analysis ( distance & proxmity )
Marketing questions • Too close to existing shops? • Similar characteristics to existing locations? • Where are the competitors? • Where are the customers? • Where are the customers that are spending the most money?
Shops w/in 1 mile will compete for customersPotential shops > 1 mile away Flowchart (GIS Analysis Model)
Result: yellow/orange = close to shopspurple/blue = farther away
Spending Density Function, Customer Spending
Result: Dark blues are greatest density of customer spending
Spending density ([Distance to Shops] > 5280) & ([Spending density] > .02) Find areas 1 mile from an existing shop that are also in a high spending density customer area
Result: Best locations for a new Beaneryw/ proximity to an interstate highway, zoning concerns, income levels, population density, age, etc.
Visualization & Spatial Analysis:An Example from The Districthttp://dusk.geo.orst.edu/gis/district.html
Uncertainty in the Conception, Measurement, and Representation of Geographic Phenomena • Previous examples assumed it didn’t exist • Conception of Geographic Phenomena • Spatial Uncertainty - objects do NOT have a discrete, well-defined extent • Wetlands or soil boundary? • Oil spill? pollutants or damage? • Attributes - human interp. may differ
Uncertainty in Conception • Vagueness - criteria to define an object not clear • What constitutes a wetland? • An oak woodland means how many oaks? • Seafloor ages/habitats • What does a grade of “A” really mean?? • Presidential vagueness: “it depends on what the meaning of ‘is’ is”
Uncertainty in Conception • Ambiguity - y used for x when x is missing • Direct indicators: salinity (x) or species (y) • Indirect more ambiguous • Wetlands (y) of species diversity (x)?? Figure courtesy of Jay Austin, Ctr. For Coastal Physical Oceanography, Old Dominion U.
Uncertainty in Conception • Regionalization problems • What combination of characteristics defines a zone? • Weighting for composites? • Size threshold for zone? • Fuzzy vs. sharp
Uncertainty in Measurement • Physical measurement error • Mt. Everest is 8,850 +/- 5 m • Dynamic earth makes stable measurements difficult • Seismic motion • Wobbling of Earth’s axis • Wind and waves at sea!
Uncertainty in Measurement • Digitizing error, e.g., • Undershoots • Overshoots • “Gafs”
Uncertainty in Measurement • Misalignment of data digitized from different maps • Rubbersheeting is a corrective technique
Uncertainty in Measurement • Different lineages of data • Sample vs. population
Uncertainty in RepresentationRaster Data Structure Classification based on dominance, centrality? mixels
Uncertainty in RepresentationVector Data Structure Zones based on only a few points Points in corners of polys
Uncertainty in AnalysisEcological Fallacyan overall characteristic of a zone is also a characteristic of any location or individual within the zone Factory w/no Chinese employees may have closed
Modifiable Areal Unit Problem (MAUP) • number, sizes, and shapes of zones affect the results of analysis • Many ways to combine small zones into big ones • No objective criteria for choosing one over another Path of boundary changes where high pop. is
Uncertainty of Geographic Phenomena • Conception - spatial, vagueness, ambiguity, regionalization • Measurement - field, digitizing, lineage • Representation - raster, vector • Analysis - ecological fallacy, MAUP