Download

1 / 24
240 likes | 316 Views
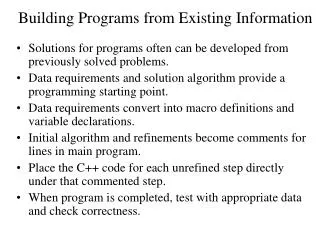
MODELLING THE EXISTING BUILDING STOCK Phil Jones Welsh School of Architecture. Royal Commission on Environmental Pollution Energy - The Changing Climate. Royal Commission on Environmental Pollution. Carbon reductions: 60% by 2050 80% by 2100. Energy White Paper, March 2003

E N D
MODELLING THE EXISTING BUILDING STOCK Phil Jones Welsh School of Architecture
Royal Commission on Environmental Pollution Energy - The Changing Climate
Royal Commission on Environmental Pollution Carbon reductions: 60% by 2050 80% by 2100
Energy White Paper, March 2003 • Calls on Building Regulations to implement further energy savings • Brings forward the next release of Part L to 2005
Carbon saved in 2010 in E&W Predicted from ADL 2002 3% from air conditioned bldgs 21% from new dwellings 29% from naturally ventilated non-domestic bldgs 47% from existing dwellings Total saving in 2010 = 1.4 MtC - Ca 8%of the total national saving.
Need to reduce carbon emissions in the existing building stock EU Energy Performance of Buildings Directive (EPBD) - Existing buildings over 1000m2 Sustainability and Security Bill - Include buildings less than 1000m2
Amendment to Part L • end of 2005 • out to consultation JULY 2004
Potential for energy savings in housing A - New build semi-detached dwelling built above current building regulations B - New build semi-detached dwelling built to current building regulations C - Pre 1919 mid-terrace property with energy efficiency improvements D - Pre 1919 mid-terrace property without energy efficiency improvements
Energy and Environmental Prediction (EEP) Model ‘ a computer based tool for storing and predicting energy use, related emissions and other environmental factors’
Application of EEP model to Neath Port Talbot CBC • 60,000 domestic properties. • 4,000 commercial properties. • 75 industrial processes. • All properties have been surveyed as part of the application of the EEP model to the local authority area.
ENERGY - Operation of existing stock Data is collected and entered to a single house level. Information is represented to postcode level within GIS MapInfo. All data is labeled by its source postcode and stored within a general database.
The domestic sub-model - collecting data • Details collected for every domestic property: • Age • Heated ground floor area • Window area (A) • End area • No. of storeys • Storey height (C) • Facade • Assumptions: • Heating system • Water heating system • Type of fuel • Energy efficiency measures e.g. insulation • The information is collected from a variety of sources including: • Computer based ordnance survey maps • Site visits • Historical records including Ordnance Survey maps and Electoral Roll Registers
The domestic sub-model - monitoring baselines • CO2 emissions, SAP ratings and yearly energy cost calculated at postcode. • Information mapped in GIS to enable CO2 or energy hotspots to be targeted.
Predict energy savings - domestic properties a - current emissions b - installation of double glazing c - installation of condensing boile d - draught stripping e - insulation of hot water tank, f - roof insulation g - combination of b, c, d and f
Thematic map illustrating the variation in energy use from domestic properties
Neighbourhood Assessment Tool (NAT) • Property level observations • Maintenance of property/gardens • amount of trees present in gardens • broken/boarded up windows, • abandoned cars, • general property maintenance. • Beautification • evidence of pots, furniture and ornaments, placed in location that is potentially accessible to the public. • Defensible space • height of surrounding boundary.
EEP model data base Red lines major roadsDark blue line M4Grey areas postcodes areas surveyed
The EEP data can be used as a stock profiler Ages of all domestic propertieslocated within Wales Ages of all domestic properties located within NPTCBC Pre 1919 Pre 1919 Post 1964 Post 1964 35% 33% 23% 25% 1919 - 1945 - 1945 - 1944 1919 - 1964 1964 18% 1944 26% 27% 13% Ages of council domestic properties located within NPTCBC Ages of private domestic properties located within NPTCBC Pre 1919 5% Post 1964 Post 1964 Pre 1919 25% 25% 42% 1919 - 1944 11% 1945 - 1964 20% 1945 - 1919 - 1964 1944 59% 13%
Map showing average ward SAP ratings. Three areas have been identified with an average SAP rating of less than 40.
120 A100 to 120 105 B85 to 99 90 C70 to 84 More Energy efficient SAP ratings Less energy efficient 75 D55 to 69 60 Private E40 to 54 Council 45 F25 to 39 30 G0 to 24 15 0 0% 10% 20% 30% 40% 50% 60% 70% Percentage of homes having SAP ratings in the indicated ranges SAP rating breakdown for all private and council domestic properties Average SAP - 47.5Private - 47.6Council - 46.9
SAP rating breakdown for council properties if council properties meet the WHQS guidance - total cost £26,135,505 120 A100 to 120 105 B85 to 99 90 C70 to 84 More Energy efficient SAP ratings Less energy efficient 75 D55 to 69 60 E40 to 54 45 F25 to 39 30 G0 to 24 15 0 0% 10% 20% 30% 40% 50% 60% 70% Percentage of homes having SAP ratings in the indicated ranges Average SAP - 68.9
SAP rating breakdown for council properties if council properties had all HEES energy efficiency measures - total cost £56,598,260 120 A100 to 120 105 B85 to 99 90 C70 to 84 More Energy efficient SAP ratings Less energy efficient 75 D55 to 69 60 E40 to 54 45 F25 to 39 30 G0 to 24 15 0 0% 10% 20% 30% 40% 50% 60% 70% Percentage of homes having SAP ratings in the indicated ranges Average SAP - 74.7
Thank you jonesp@cf.ac.uk