Download

1 / 74
740 likes | 1.16k Views
ECEN 5341/4341 Lecture 7 February 1, 2019. Chapter 5. Assignment. 1. Finish reading chapter 4 and the first half of chapter 5. I consider chapter 5 to be important as a basis for explanations of how you go from the physics to the biology. Maxwell’s Equations. Basic Equations

E N D
ECEN 5341/4341 Lecture 7February 1, 2019 Chapter 5
Assignment • 1. Finish reading chapter 4 and the first half of chapter 5. I consider chapter 5 to be important as a basis for explanations of how you go from the physics to the biology.
Maxwell’s Equations Basic Equations The polarization p couples the fields to the materials The dielectric constant ε may be complex and we usually only need the first term MB is the magnetic polarization per unit volume
Forces • Lorentz Equation • Examples Typical fields across a membrane are 2x10⁷ V/m and drifts in proteins may occur at 2 V/m or less. • Thermal velocities for Na+ ≈ 4x10² m/sec in B≈5x10⁻⁵ T yield F≈ q (2x10⁻² V/m)
Forces on Dipoles • 1 First order forces for permanent dipole Po • 2 For induced dipole moments • 3. The resulting current flow Ji
Drift Current Flows • Two components to force on a charged particle • The current is summed over all the molecules and ions
Mobilities • Blood Saline σ=1.4S/m
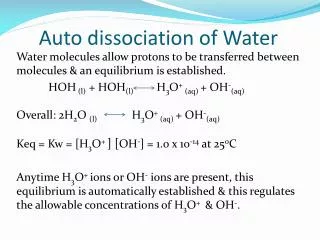
Water Dipoles brid orbitals of oxygen (14) brid orbitals of oxygen (14) Figure 2 Two descriptions of bonding in H2O. The observed angle between the two O—H bonds is 105o (a) H2O based on s, px, py and pz orbitals oxygen (b) H2O based on sp3hy
Figure 5 Theoretical predictions of the stabilities of the five lowest-energy water hexamer structures. Values of De (lower line – lowest equilibrium dissociation energy) and Do (upper line – quantum vibrational zero-point energy) are shown. The zero-point energy is equal to Do-De (18)
Water Clusters • Figure 3 An expanded icosahedral water cluster consisting of 280 water molecules with a central dodecahedron (left) and the same structure collapsed into a puckered central dodecahedron (right). (16; 17) .
Bound Water Molecule • 1.Computer simulations show a rather large number of configurations for bound water that surrounds some of the ions that are of most interest in the study of the effects of electric fields on biological systems. • 2. This leads to the fact that some small ions my have larger effective radius than big ions and lower mobility.
Figure 6. Structures for the putative global minimum: (a) Na+(H2O)20, (b) Cl-(H2O)17, and (c) Na+(H2O)100. (25)
Water Molecules • 1. Water molecules bind to proteins in different places and are important in the shape of the structure and determining the ability of other molecules and ions to bind or activate things like DNA replication. • 2. Water in a cell is more structured than in a pure state and has a higher viscosity.
A Beta-Sheet • 1
Table 1 Ionic mobilities in water at 298 K, u/(108 m2 s-1V-1) (12).
Table 2 Limiting ionic conductivities in water at 298 K, /(S cm2 mol-1) where is molar conductivity (12)
Water Viscosity • Additional it has been shown that modulated weak RF fields can modify the diffusion rate for NaCl. Exposures to 450MHz with an SAR of 0.4W/kg and an estimated electric field of 25.6 V/m is shown to reduce the viscosity of NaCl in water increase the rate it diffuses. • Hinrikus, H., Lass, J., Karai, D., et al. (2014). Microwave effect on diffusion: A possible mechanism for non-thermal effect. Electromagn. Biol. Med. 34:327–333.
Forces on Dielectric Sphere with ε2in • Assume • Viscous Drag Mobility
Osmotic Pressure • Average diffusion pressure on a particle • Special case of a sphere. • Maximum when the field is at the surface of a membrane
Diffusion Currents ( ) 1 The diffusion currents go with the gradient of the concentration. The ratio of the diffusion to drift current Maximum Voltage required Wi≈ 2mV
Forces 1. Like charges repel and opposites attract. So a screening double charge layer builds up at the surface of a membrane.
Van der Waals Forces • For like particles the forces are repulsive at short distances ).1 to 0.2nm and attractive at longer ranges. They are caused by fluctuations in the induced dipole moments. • For individual atoms F~ 1/r7 however for two surfaces at a distance dw they decrease much more slowly. For two membranes this is about 20nm See Intermolecular and Surface Forces by Jacob Istaelachvili
Hydration Forces • 1. These forces are repulsive and rise rapidly between membrane bilayers • There are other long range attractive forces between hydrophobic surfaces that appear to be generated by the induced dipole moments out to about 25 nm.
Electric Field Effects • 1. Electric fields add a small drift velocity on to the large random thermal velocity. • 2. For E =1kV/m we would expect for Na+ drift velocity v= 5x10⁻⁵m/sec , • Thermal velocity v= 400m/sec • 3. For larger particles the drift velocity is slower so the velocities are microns per second to microns per minute.
Chemical Reaction Rates • 1. A basic chemical reaction • If Ao is large and n = m =1 then
Changes in Collision Rates z • 1. The drift current may add or subtract from the number of particles colliding at a membrane surface. • 2. It can block the reaction or grow it exponentially at voltages of a few volts/m • The enhancement of the sorption reaction rate for charged reactants onto a reactive colloidal particle is shown to be proportional to E2 ω½ for values of ω< 1010 radian/second and small applied fields. At high frequencies, ω> 1010 radians/second the sorption reaction rate goes as E2 ω-2 [Raudino 1993].
. Steric Effect • . An electric field exerts a force on a molecule with a dipole moment to align the molecule along the field. This effect is in a constant direction for an induced dipole moment and to first order varies with the square of the electric field. The average orientation is governed by the Langevin equation • <cos ()> =coth (25) • where is the angle between the electric field and the dipole moment. The size of the induced dipole moment, and thus WDEP, the energy acquired from the field, will also be dependent on . For weak fields <cos (>
Changes in Energy and Energy Levels Only Discreet Transitions Allowed • Allowed • Energy • Levels • Variable B or E
Stark Effect • 1. These are changes In the energy levels of atoms and molecules with electric fields. • 2. They can occur as result in the change in orientation of dipole moments, induced dipoles , and changes in vibrational and rotational energies. • 3. Rotational energy level transitions often occur in the microwave region. • . Townes and Schawlow 1955
Shift in Energy Levels with Electric Fields [Stark Shift] is the electronic dipole moment for a molecule Typical values for P are = 3.3 x 10⁻³⁰ to 6.6 x 10⁻³⁰ Cm To excite transitions between adjacent energy levels fields of E ≅ 2x10⁷V/m for frequencies of a few kilohertz required
Stark Effect • Energy levels
Changes in Energy • 1 At study state or constant temperature the Boltzmann population distribution of energies Boltzmann distribution function which in turn leads the ratio of the number of particles N2 with energy, W2, to the number of particles N1 with energy W1 so that • N2= N1e–ΔW/kB T • where kBis Boltzmann’s constant. ΔW is the difference in energy between the two particles.
Fermi Distribution in Solids • 1 Energy levels reference to thermal WT =0.026 eV. Need about 0.1 eV to activate most chemical effects. Catalyst can reduce this.
Magnetic Field EffectsZeeman Shifts in Energy Levels • W • B
Population Saturation Population difference of states in AC field is Where is population of one state, is the gyromagnetic ratio, B1 is the AC magnetic flux density, T1 is the relaxation time between states and T2 is the nuclear spin relaxation time (Bovey et al., 1988).
Additional change • 1. Changes in the conformation of molecules that change the dipole moment. • 2. Changes in the rotational velocity. • 3. Stark Shift in energy levels.
RF Thermal Effects • 1 Power absorbed. • 2. Temperature change • 3. Changes in chemical reaction rates
Protein-Protein Reactions • 1. These are important biological reactions and can take place in at least two ways. A. Force fit B. Configuration recognition 2. There are a very large number of possible configurations . For 100 base pairs 1089