Download
1 / 27
270 likes | 364 Views
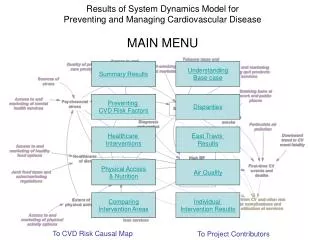
PRISM. LAB 5: “The Puget Sound Model” Marine water dynamics. OR, WHAT GOES AROUND COMES AROUND (AND DOWN AND UP).

E N D
PRISM LAB 5: “The Puget Sound Model”Marine water dynamics OR, WHAT GOES AROUND COMES AROUND (AND DOWN AND UP)
The model was constructed in 1950 with funds provided by the Office of Naval Research and under the direction of Professor Clifford A. Barnes to investigate the tidal currents in Admiralty Inlet. The extreme complexity of tidal flow in this area makes a detailed understanding of their characteristics very difficult, if not almost impossible, by field observations alone. A physical model was considered to be the most appropriate method for obtaining the desired information, provided that acceptable representation could be achieved. Prior to the start of construction of the present model, a detailed theoretical study was made to investigate suitable model scales. These studies resulted in selection of a horizontal scale of 1:40,000 and a vertical scale of 1:1,152. From these two scales all others are derived by mathematical relationships. The model basin was formed by making a concrete casting from hand-carved wood patterns. Charts of the area were contoured and the contours transferred at the proper scale to pine boards planed to a thickness corresponding to the contour intervals. .. The tide computer constructed for the model is the Kelvin type
0 meters 200 meters Puget Sound is deep (and shallow), with strong tides, but sills too Whidby basin Main Basin Hood Canal South Sound
What is below the surface ?? 4 ocean river 3 2 1 Thomson, 1994 Buoyant river water flows out of an estuary on surface, dense ocean water flows in at depth, but there is mixing, and sills cause “reflux” of water back in to an estuary.
0 meters 200 meters 1. Bathymetry • Puget Sound • is fjord-like; a glacial-cut estuarine system • It is deep • Its nearshore is narrow Newton, Stormer, UW-COFS; Data source: NGDC
2. Water Movement – 2x tides (24 hours 50 minutes) Type of Tide Within Puget Sound, tides are the mixed type, having two highs and two lows each tide day. Heights of the low water generally have the greater variability. Thus each tidal day there occurs a Higher High Water (HHW), a Lower Low Water (LLW), a Lower High Water (LHW), and a Higher Low Water (HLW). Diurnal ranges vary between Spring tides (larger tide ranges) and Neap tides (smaller tide ranges) over a period of 14.3 days, but never exactly repeat. The closest repetitive cycle is approximately 18.5 years, the period of the revolution of the Moon's nodes. Range of Tide The range of tide varies within the system, nearly doubling over the distance from Port Townsend to Olympia. Tidal range variation is the result of the effect of bathymetry, length of the system, and configuration of the basins and interconnecting channels. The Diurnal Range is the difference between HHW and LLW, generally given as the mean difference.
3. salinity determine density temperature + FRESH WARM less dense SALTY COLD more dense “thermocline” or “pycnocline”
Density structure can be two different ways: “stratified” “mixed” WARM FRESH COLD SALTY
Net Circulation Puget Sound receives a volume of fresh water each year from river discharge, amounting to about 20% of its total volume. The strong tidal currents and turbulence mix the fresh water and seawater. The inflowing river water must escape to the ocean and in doing so, as a result of mixing, carries about nine or ten times its volume of seawater with it. To compensate for the loss of salt and seawater, and to maintain the salt budget, there is an inflow of more saline water from the Strait of Juan de Fuca. The flow balance is thus: 9 parts salt water inflow + 1 part river runoff = 10 parts mixed outflow. Because the mixed water is of lower salinity and therefore of lower density, a net outflow occurs near the surface and a net inflow at depth. A incoming saltwater river or freshwater input upwelling bottom current
Puget Sound circulation is retentive Strait of Juan de Fuca Tacoma Sill
Stratification patterns in Puget Sound: 2007 Puget Sound Update, Data source: Ecology/PSAMP
Residence Times (relative) medium slow fast medium very slow slow
And more things vary than just temp. and salinity: Lo nutrient Hi oxygen Phytoplankton present Effluent Phytoplankton present Hi nutrient Lo oxygen No phytoplankton No phytoplankton Respiration { CO2 + H2O C(H2O) + O2 } sunlight nutrients Photosynthesis
4. PNW estuaries have strong influence from climateGlobal influence on:ocean conditions watershed conditions local weather NASA SeaWiFS Image
Puget Sound is the only fjord-like estuary that functions with all of these attributes, and that supports intensive human and urban development, in the world.