Download
1 / 18
180 likes | 473 Views
Knowledge about Crash Risk Factors and Self-Reported Driving Behavior. Exploratory Analysis on Multi-State Teen Driver Survey By Lisa Minjares-Kyle, M.S., CPPE, CPST Associate Transportation Researcher Texas A&M Transportation Institute. Why Are We Here?.

E N D
Knowledge about Crash Risk Factors and Self-Reported Driving Behavior Exploratory Analysis on Multi-State Teen Driver Survey By Lisa Minjares-Kyle, M.S., CPPE, CPST Associate Transportation Researcher Texas A&M Transportation Institute
Why Are We Here? Car crashes are the leading cause of death forteens and young adults. 2,820 teens died in 2016 and thousands are injured in car crashes every year. Equivalent to a school bus fullof teens crashing everyweek for a year.
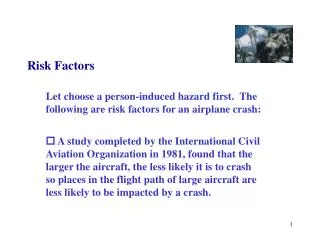
The Fundamental Reason Driver inexperienceis the #1causefor teen crashes..
Top Teen Driving Risks (Source: National Safety Council)
Overview/Methodology • Demographics • Knowledge of top risk factors • Traffic background • License status • Driver education history • Crash/citation history • Self-reported driving behaviors within past 30 days
17.6% Of teens reported receiving an on-road driving test before receiving a license. Demographics FM L P U N
Talked on a Cell Phone or Texted while Driving “Some” Talked on a Cell Phone or Texted while Driving “A Lot” More than 5 times in past 30 days Between 1-5 times in past 30 days
Driven or Ridden without wearing a Seat Belt “A Lot” Driven or Ridden without wearing a Seat Belt “Some” More than 5 times in past 30 days Between 1-5 times in past 30 days
Driven 10 MPH Over Speed Limit “A Lot” More than 5 times in past 30 days
Driven after drinking alcohol “A Lot” Driven after drinking alcohol “Never” More than 5 times in past 30 days
Driven or Ridden with Teens without an Adult “A Lot” More than 5 times in past 30 days
Driven After 10 PM without an Adult “A Lot” More than 5 times in past 30 days
Top 10 Reported Risk Factors Drinking Text Phone Seat Belt Drug Speed Talking Distraction Inattention Music
Bottom 10 Reported Risk Factors Careless Sleep Eating Friends Smoking Tired Passengers Light Road Weather
F Gender Differences M
Conclusions Most Frequent Risky Behaviors reported • Distractions related to cell-phone use • Speeding • Riding with teens • Driving after 10 pm Significant lack of Risk identification for • Night time risk factors • Teen passengers Significant gender differences for • Texting, passengers, speeding and seatbelts Limitations • Random effect for states outside of Texas • Small sampling size
Thank you! Lisa Minjares-Kyle, M.S., CPST, CPPE Phone: 713-613-9211 E-mail: l-minjares@tti.tamu.edu