Download
1 / 39
390 likes | 553 Views
AST101 :Lecture 13 Stars. “…My God, it’s full of stars!”. Stars. Observables: Brightness Color Spectra Position. Position. Brightness. Magnitude scale: rooted in history The brightest stars were designated Stars of the first magnitude

E N D
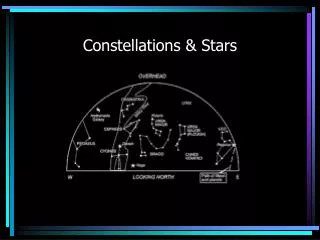
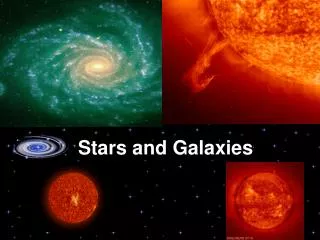
Stars Observables: • Brightness • Color • Spectra • Position • Position
Brightness • Magnitude scale: rooted in history • The brightest stars were designated Stars of the first magnitude • Lesser luminaries were Stars of the second magnitude • The Greeks recognized 5 magnitudes. • The eye has an approximately logarithmic response: magnitude differences correspond to brightness ratios
Magnitudes Consequently, magnitudes are • Logarithmic, and • Backwards The brightest stars have the smallest magnitudes
Magnitudes The magnitude scale was quantified in the 17th and 18th centuries • 1 magnitudedifference = ratio of 2.512 in brightness • 5 magnitudes = factor of 100 in brightness (2.5125 = 100) • Vega has a magnitude of 0.0 (definition) • Brighter stars have negative magnitudes • Sirius: mag = -1.6 • Sun: mag = -26 • Full moon: mag = -12 • Venus (at brightest): mag = -4 • Faintest nakest eye stars: mag = +6.5 • Faintest objects detected: mag ~ +30
Magnitudes Apparent magnitudes (m): what we see Absolute magnitudes (M): pegged to luminosity M is the magnitude you would see at a distance of 10 parsecs (32.6 light years) M = 4.8 Distance modulus (DM): a measure of distance DM = m - M = 5 log(d) -5
Colors • The eye perceives colors only in the brightest stars • Stars have colors because, to a first approximation, they radiate as blackbodies
Astronomical Colors Colors are differences in magnitudes (= ratio of fluxes) • B-V color = B mag - V mag • Larger values are redder colors • Smaller values are bluer colors • By definition, the colors of Vega = 0 Color is indicative of temperature Red indicates cool Blue indicates hot
Bandpasses Human response to visible light (cone cells)
Astronomical Bandpasses UBVRI filter responses
Spectra of Stars • All stars have an opaque photosphere • continuum emission • Most stars have absorption line spectra • cool photosphere • Some also show emission lines • hot or extended circumstellar gas
Spectral Types • O • B • A • F • G • K • M • L • T • Y
Spectral Types An empirical scale based on appearance of the spectrum • Originally based on the strengths of absorption lines: A, B, C, D, E … • Now reordered into a temperature sequence • Spectral types have subtypes, e.g., B0, B1, B2 … B9 • Spectral types have qualifiers, e.g., M5e
Spectral Types • O: Hottest stars; temps from ~20,000K to > 100,000K. Weak helium absorption. • B: Temperatures from 10,000 to 20,000K. Noticeably blue. Examples: Rigel, in Orion, and Spica, in Virgo. • A: Temperatures from 8000-10,000K. They appear white. Strong absorption lines of hydrogen. Examples: Vega, Altair, Sirius. • F: slightly hotter than the Sun. Absorption lines of metals appear. Procyon is an F star. • G: temperatures between 5000 and 6000K. Appear yellow. Examples: Sun, α Centauri, Capella. • K: Temperatures 3000 - 5000K. Appear orange. Arcturus is a K star. • M: the coolest stars; 2000 - 3000K. Molecules can survive (H2O, CO, VO, TiO). Noticeably red. Examples: Betelgeuse, Antares. • L, T, and Y objects are brown dwarfs, not stars
Spectral Type Mnemonics OBAFGKM • OBe AFine Girl/Guy, Kiss Me. • Old Bald And Fat Generals Keep Mistresses. • OBoy, An FGrade Kills Me. • Only Boring Astronomers Find Gratification Knowing Mnemonics
The Hertzsprung-Russell Diagram • X-axis: color, temp, spectral type • Y axis: absolute magnitude, luminosity Reveals giants, dwarfs, and the main sequence (distances from parallax)
Luminosity Classes • I: supergiants • II: bright giants • III: giants • IV: subgaints • V: dwarfs - the main sequence • VI: subdwarfs • WD: white dwarfs A luminosity, or pressure sequence. Observable in the spectra. The Sun is G2V
Understanding the H-R Diagram • Most stars are on the main sequence. • Stars spend most of their life on the main sequence • Most stars are faint and red • Giants and supergiants are visible from great distances. • Giants and supergiants are rare.
Binary Stars Stellar masses can be determined using Newton’s version of Kepler’s third law, (M1+M2)= (4π2/G) a3/P2
Types of Binary Stars • Visual pairs • Eclipsing binaries • Spectroscopic binaries
Star Clusters All members have the same • Age • Distance from Earth • Composition A testing ground for theories of • Star formation • Stellar evolution
Globular Clusters 47 Tucanae
Galactic, or Open Clusters h and Χ Persei
HR Diagrams of Clusters • Ages come from a number of types of observations • Provide clues to the evolution of stars
Stellar Lifetimes. I • Stars generate luminosity through fusion of H into He • The lifetime of a star is proportional to the amount of fuel it has (mass) divided by the rate at which it expends the fuel (luminosity) • The lifetime τ ~ M/L • This is analogous to determining how often you have to refill the gas tank in your car. Time remaining is the amount of fuel you have (the size of the tank) by your average usage (gallons per day).
Stellar Lifetimes. II. • τ ~ M/L • From the H-R diagram, L ~ M3 (on the main sequence) • Plugging this in for L τ~ M-2 • The most massive O stars are about 100 M. • τO ~ 10-4 τ, or about 106 years. • The least massive M stars are ~0.1 M. • τM ~ 102 τ, or about 1012 years.
Stars • Stars are in hydrostatic equilibrium: gravitational pressure balances gas pressure. • Stars are generally stable for long times • Stellar properties are determined solely by their mass, composition, age, and rotation rate. • The properties of main sequence stars are largely determined by their masses. • Single stars are spherical, unless distorted by rotation
Distorted Stars Altair: rapid rotator W UMa: contact binary
Stars Summary • Stars are gaseous spheres fusing hydrogen • Spectral types form a temperature sequence • The H-R diagram shows organization • Stars are found in pairs, or in clusters • Stellar lifetimes depend on masses