Download
1 / 27
270 likes | 328 Views

E N D
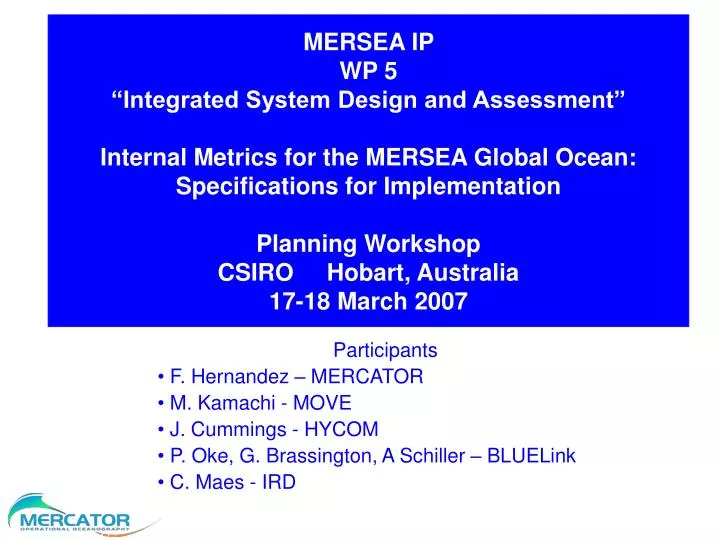
MERSEA IP WP 5“Integrated System Design and Assessment”Internal Metrics for the MERSEA Global Ocean:Specifications for ImplementationPlanning Workshop CSIRO Hobart, Australia17-18 March 2007 Participants F. Hernandez – MERCATOR M. Kamachi - MOVE J. Cummings - HYCOM P. Oke, G. Brassington, A Schiller – BLUELink C. Maes - IRD
Validation « philosophy » • Basic principles: defined for ocean hindcast and forecast (Le Provost 2002, MERSEA Strand 1): • Consistency: verifying that the system outputs are consistent with the current knowledge of the ocean circulation and climatologies • Quality (or accuracy of the hindcast) quantifying the differences between the system “best results” (analysis) and the sea truth, as estimated from observations, preferably using independent observations (not assimilated). • Performance (or accuracy of the forecast): quantifying the short term forecast capacity of each system, i.e. Answering the questions “do we perform better than persistency? better than climatology?… • A complementary principal, to verify the interest of the customer (Pinardi and Tonani, 2005, MFS): • Benefit: end-user assessment of which quality level has to be reached before the product is useful for an application
Validation « methodology »: classes of metrics • Class 1, 2, and 3 metrics allow the consistency and quality of each system to be deduced • The performance of each system is addressed using Class 4 metrics • The benefit is assessed using all classes of metrics, but new « user-oriented » metrics may need to be defined to fully address this principle • Class 1 to 3 metrics are provided on a real-time basis through OPeNDAP servers using a standardized NetCDF format • The metrics have to be implemented in the same way for the different systems (fully standardized output fields and diagnostics) • Class 4 metrics remain to be properly defined.
Class 1 METRICS: General Overview of the System Dynamics Comparison of 2D model fields interpolated to the GODAE grid • zonal and meridional wind stress, total heat flux, freshwater flux • barotropic stream function • mixed layer depth – defined by change in T of 1C and change in density of 0.05 kg/m3 • sea surface height • mean dynamic topography Comparison of 3D model fields interpolated to the GODAE grid • potential temperature • salinity • u,v velocity components Class 1 metrics provide instantaneous estimates of the ocean from the different GODAE systems for direct inter-comparison Types of outputs need to be defined: hindcast/best estimate, analysis, forecast Gridding (horizontal and vertical) and regional divisions need to be defined
1/2° Class 1 METRICS: How Do We Define the GODAE Grid? 1/4° Grid in Tropics
1/2° 1/6° 1/6° 1/6° 1/6° 1/6° 1/6° Elsewhere
1/2° 1/8° 1/6° or 1/8° 1/6 ° or 1/8° in Polar Regions
Class 2 METRICS: High Resolution for Monitoring Ocean Dynamics Designed as virtual moorings or sections in the model domain • mooring locations are provided (match in situ moorings) • section locations are computed every 10 km (15 km in Arctic) • section and mooring model outputs are « best estimate » daily means Variables to consider • potential temperature • salinity • velocity Class 2 metrics provide direct comparison of model outputs with in-situ observations Sections follow WOCE and CLIVAR repeat sections, but new definitions are being proposed – there must be some hope of the section being observed for it to be included
Class 3 METRICS: Derived Physical Quantities Derived physical quantities computed using model variables • cannot be derived from class 1 or class 2 information • need to be computed in line, during the model run, on the native grid, every model time step • represent integrated quantities on the model grid Variables to consider • volume transports • overturning stream function (function of latitude and depth or temperature or density) • meridional heat transport Class 3 mterics are designed to check physical apsects of the model behavior Sections and/or locations for Class 3 diagnostics will incorporate Class 2 definitons
MOORINGS XBT lines SECTIONS and TRANSPORT WOCE CLIVAR CANADIAN SECTIONS SOOP GLOSS TAO PIRATA MFS MODEL T XBT Observed T MODEL/WOCE-CLIVAR SECTION VOLUME TRANSPORT across FLORIDA Strait : MODEL/CABLE Comparison MODEL/OBS comparison Model/Tide gauge SLA time series comparison Class 2 and 3 METRICS: Moorings, XBT Lines and Repeat Sections
Class 2 and 3 METRICS: Standard Vertical Levels (continued) Total Number of Vertical Levels = 33
Class 2 and 3 METRICS: New Proposed Definitions for the Pacific
Class 2 and 3 METRICS: New Proposed Definitions for the Pacific
Class 2 and 3 METRICS: New Proposed Definitions for the Pacific
Class 4 METRICS: Performance of the Forecasting System Measures the skill of the forecasting system • describes the ocean and its forecasting skill at same time • sets of observations are chosen (independent from those used in the assimilation) and compared to model fields • model fields must be describing the same situtaion (i.e., forecast for day of observation from model forecast runs into the past) • climatology and persistence forecast field comparisons are to be included Variables to consider • all analysis variables (varies with system) Data to consider • any set of data can be used, as far as equivalent information can be computed from the model variables Definition of Class 4 metrics comparison domains (lat/lon boxes) not fully achieved yet.
+ + + + + + + + + + + + + + + + + + Class 4 METRICS: Concept • Truth • Climatology One model variable • Initial conditions (previous analysis) • Forecast • Persistence • Observations • Analysis • Hindcast time windowto compute stats T0 Time T0+7
Class 4 METRICS: Implementation • Implementation of T/S observation based Class 4 metrics • Coriolis provides daily files of quality controlled T/S observations • every forecasting center computes their “model-to-obs” dataset using the Coriolis observations • Computation and binning of Class 4 statistics • statistics (box averaging…) not yet defined • per dedicated geographical boxes or in regular boxes? • per vertical layers (0-100m, 100-500m, 500-5000m?)
Class 4 METRICS: Presentation of Temperature Comparisons 0 to 50 m 50 to 200m 200 to 700 m Coriolis database for the North Pacific October 2006
Class 4 METRICS: Binning of Observations • Testing different boxes: • Global ocean: 15°x15°, 1 month, one data/file • Dedicated boxes also for: • Baltic, NEA, Arctic, MED December 2006 All Vertical Levels February 2007 500-2000 m Depth
Class 4 METRICS: Binning of Observations Bin averaging within dynamical regimes?
Class 4 METRICS: Binning of Observations More ways of binning within dynamical regimes
Summary: Way Forward and HYCOM Consortium • Global metrics plan follows Le Provost (et al.) from first GODAE Symposium • Builds upon existing basin-scale metrics defined for GODAE • North Atlantic (F. Hernandez), Equatorial Pacific (M. Reinecker), • Global Reanalysis (T. Lee), North Pacific (Kamachi et al.) • Australia/Indian Ocean (Oke and Brassington) • Goal is to complete global metrics definitions in time for next IGST meeting (Aug) • HYCOM and Mercator only global GODAE systems • Metrics implementation timed to coincide with Mercator going global with multivariate assimilation (0.25 deg resolution - in demo mode now, metrics evaluation Spring, 2008) • MOVE (Japan) and BLUELink (Australia) will participate where they can • How much should HYCOM consortium participate? • tremendous amount of work being proposed; impact on model run-times? • leverage on-going validation efforts for transition to NAVO • Many issues with current status of Class 4 metrics – need to address