Download
1 / 15
150 likes | 254 Views
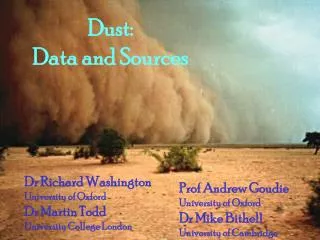
Causes of Dust. Data Analysis. Ilias Kavouras, Vic Etyemezian, Dave DuBois, Mark Green, Marc Pitchford, Jin Xu Division of Atmospheric Sciences, Desert Research Institute. Scope and methodology. Scope: identify and quantify sources of airborne dust Local and regional windblown dust

E N D
Causes of Dust. Data Analysis Ilias Kavouras, Vic Etyemezian, Dave DuBois, Mark Green, Marc Pitchford, Jin Xu Division of Atmospheric Sciences, Desert Research Institute
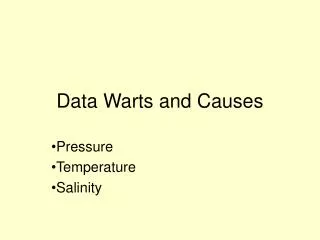
Scope and methodology Scope: identify and quantify sources of airborne dust • Local and regional windblown dust • Long-range transported dust (e.g. Asia) • Wildfire-related dust • Other unknown sources Approach: Analysis of IMPROVE network and meteorological data • Chemical fingerprints of dust (e.g. Asian, wildfire-related) • Multivariate statistical analysis of Dust concentrations, wind speed/direction and precipitation
Database development RAWS Days with precipitation for more than 12h or precipitation occurred after 12:00 p.m. CASTNET AZDEQ Central Meteorological Database Modified Central Meteorological Database ISH NPS NASA Grouped in 16 categories according to wind speed/direction WS1=0-14, WS2=14-20, WS3=20-26, WS4>26 mph WD1A=315-45, WD2A=45-135, WD3A=135-225, WD4A=225-315 WD1B=0-90, WD2B=90-180, WD3B=180-270, WD4B=270-360 “Dust” Database “Dust” Meteorological Database IMPROVE database
Sensitivity analysis Regression coefficients “Dust” Database “Model” Database GPS data Maps for each day IMPROVE-data YES/NO Meteo-data YES/NO “Dust” event YES/NO Precipitation YES/NO When? 0-12 or 12-24 “Worst” day YES/NO “Worst dust” day YES/NO
Statistical analysis – Multi-linear regression analysis • Measurement inter-correlations:Durbin-Watson test: mostly higher than 1.4 • Tolerance: higher than 0.80 • Linear regression was done using three methods: • Forward selection: One component is added (if p> [set value], rejected) • Backward selection: One component is removed if p> [set value] • Stepwise selection: One component is added; those with p > [set value] are eliminated
Statistical analysis – Criteria development • Significance level: 0.100 or 0.150 or higher • Valid prediction: Cpredicted– Epredicted > 0 or P0.05,Measured
1. Salt Creek – descriptive statistics Monitoring period: 01/01/01 – 12/31/03 IMPROVE database completeness: 93.2% Meteorological database completeness: 82.4% Measured dust mass Predicted dust mass
1. Salt Creek – Predicted vs. Measured Dust A-groups Worst dust days: 7 / 4 B-groups
2. Bandelier Nat. Mon.– descriptive statistics Monitoring period: 01/01/01 – 12/31/03 IMPROVE database completeness: 92.6% Meteorological database completeness: 76.4% Measured dust mass Predicted dust mass
2. Bandelier Nat.– Predicted vs. Measured Dust A-groups Worst dust days: 3 / 1 B-groups
Date: May 15, 2003 X: Worst day +: Worst dust day O: Meteorological data available