Download
1 / 65
1.04k likes | 1.98k Views
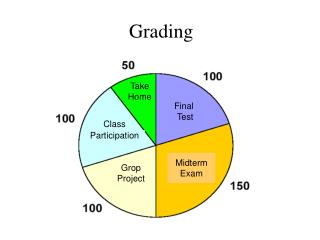
Beef Quality Grading, Yield Grading and Pricing. YG & QG. Dressing %. CH $161.32/cwt SE $154.82/cwt. $66/cwt. $109/cwt. Slaughter. Fab/Processing. Credit Items: Fat $8.50/cwt Bone $5/cwt. By-Products ($/cwt). Dressing Percentage: Hot Carcass Weight, lb Live Weight, lb . X 100.

E N D
YG & QG Dressing % CH $161.32/cwt SE $154.82/cwt $66/cwt $109/cwt Slaughter Fab/Processing Credit Items: Fat $8.50/cwt Bone $5/cwt By-Products ($/cwt) Dressing Percentage: Hot Carcass Weight, lb Live Weight, lb X 100 J. D. Tatum, 2000
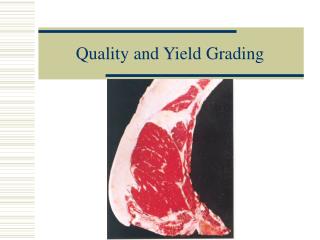
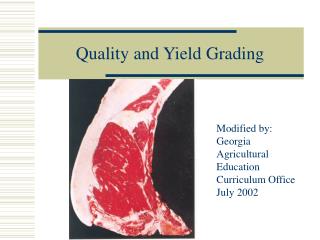
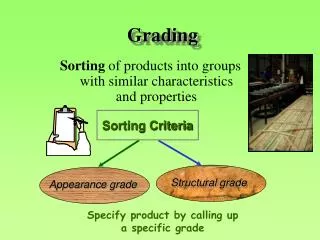
Muscling Ribeye Round Sirloin Rib Chuck Quality Marbling, color Texture, firmness Trimness Ribeye Round Sirloin Short loin Loin edge Rib Chuck KPH Cod/udder Beef Carcass Terminology
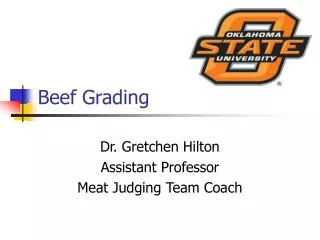
USDA Beef Quality Grades • Quality grades are an estimate of beef palatability • Tenderness • Juiciness • Flavor
Sex Classes of Beef Carcasses • Essential for Quality Grading because only Heifers, steers and Cows are Quality Graded. Graded Not Graded • Heifer • Steer • Cow • Bullock • Bull
USDA Quality Grades Based on consideration of two general factors: • Physiological Maturity • Skeletal Maturity • Lean Maturity • Marbling (Intramuscular Fat) • Amount • Distribution
USDA Beef Grades • USDA Maturity Scores: • A, B, C, D, E (young to old) • USDA Marbling Scores: • Abundant, Moderately Abundant, Slightly Abundant, Moderate, Modest, Small, Slight, Traces, Practically Devoid, Devoid (most to least intramuscular fat)
USDA Quality Grades • Grades of Youthful Carcasses (< 42 mos.) Prime Choice Select Standard • Grades of Mature Carcasses (> 42 mos.) Commercial Utility Cutter Canner
Physiological Maturity vs Chronological Maturity • The physiological maturity of the carcass is an estimate of the actual chronological age of the animal USDA Maturity Score Estimated chronological age A 9 to 30 months B 30 to 42 months C 42 to 72 months D 72 to 96 months E 96 or more months
Physiological Maturity • Skeletal Maturity is determined by evaluating the condition of the cartilage in the vertebral column, with heavy emphasis placed on the cartilaginous buttons at the end of the thoracic vertebra • Lean maturity is determined by the color and firmness of the ribeye at the 12th 13th rib interface
Skeletal Maturity *Average ossification of first three thoracic vertebra
Determining Overall Maturity • Composite of Lean and Skeletal • Within 40 degrees avg. • More than 40 degrees avg. and then move 10 degrees toward the skeletal • Skeletal old and lean young cannot: • Bring to overall back to young if older than C20 • Cannot move more than 100 degrees from skeletal
Marbling Slight00 Small00 Modest00 SlightlyAbundant00 ModeratelyAbundant00 Moderate00
Additional Factors that Affect Quality Grades Ideal Discounted
Beef Yield Grades • USDA Yield Grades predict the percentage of carcass weight in boneless, closely trimmed retail cuts from the round, loin, rib and chuck
YG & QG Dressing % CH $161.32/cwt SE $154.82/cwt $66/cwt $109/cwt Slaughter Fab/Processing Credit Items: Fat $8.50/cwt Bone $5/cwt By-Products ($/cwt) Dressing Percentage: Hot Carcass Weight, lb Live Weight, lb X 100 J. D. Tatum, 2000
USDA Yield Grades Yield/Cutability estimates are determined using four criteria • Hot Carcass Weight, lbs • Adjusted Fat Thickness, in. • Ribeye Area, in2 • % KPH
USDA YG %BCTRC 1 2 3 4 5 52.3 % or More 52.3 - 50.0% 50.0 - 47.7% 47.7 - 45.4% 45.4% or Less USDA Yield Grade %BCTRC = 51.34 – 5.784(Adj.Fat) – 0.462(KPH) + 0.740(REA) – 0.0093(HCW)
Fat Thickness – 12th Rib Rib Eye Area to Hot Carcass Weight adj. Kidney, Pelvic & Heart Fat Yield Grade Basics
Step 1 Ft thickness 12th rib • Known at PYG (Preliminary Yield Grade) • Step 1. Estimate Fat thickness ¾ the distance around the ribeye. • Measured in inches. • Step 2. For every 0.1 inches add .25 to the base 2.00. • Example: • FT= 0.6 • 0.6/0.1 = 6 6 x 0.25 = 1.5 adjustment 2.0 + 1.5 = 3.5 PYG
Fat Thickness – 12th Rib Rib Eye Area to Hot Carcass Weight adjustment Kidney, Pelvic & Heart Fat Yield Grade Basics
HCW to REA • Step 1. Estimate the REA between the 12th and 13th rib. • Measured in square inches. • Step 2. Find the difference between the actual and the ribeye needed for the weight. Base 600 needs 11.0 and for every 100 lb change in HCW the ribeye area needed changes 1.2 sq. in. • Example: • Actual REA= 15.6 HCW= 725 • 15.6 - ? = ? (diff. in REA x .3)= ??
HCW to REA • Step 1. Estimate the REA between the 12th and 13th rib. • Measured in square inches. • Step 2. Find the difference between the actual and the ribeye needed for the weight. Base 600 needs 11.0 and for every 100 lb change in HCW the ribeye area needed changes 1.2 sq. in. • Example: • Actual REA= 15.6 HCW= 725 • 15.6 – 12.5 = 3.1 (3.1 x .3)= .93 • REA adjustment = -0.93
Yield Grade Basics • Fat Thickness – 12th Rib • Rib Eye Area to Hot Carcass Weight adj. • Kidney, Pelvic & Heart Fat
KPH • Step 1. Estimate the KPH fat as a % of the Carcass. • Do this by estimating the # of lbs. and dividing by HCW. • Estimate lbs. of fat by estimating the # of softballs of fat are present. 1 softball weighs about 1 lb. • Step 2. Minus the percentage from the base (3.5%) and then for every 0.5% change in KPH you adjust 0.1 to the Final Yield Grade. • Example: • HCW = 725 Lbs. of KPH = 36.25 lbs • 36.25/725= 5% 5% - 3.5% (base)= 1.5 % 1.5/.5 = 3 • 3 x .1 = .3 • KPH adjustment + 0.3 to the Final Yield grade
3 step method Summary Carcass Step 1. Fat thickness FT= 0.6 0.6/0.1 = 6 6 x 0.25 = 1.5 adjustment 2.0 + 1.5 = 3.5 PYG Step 2. Ribeye to HCW Actual REA= 15.6 HCW= 725 15.6 – 12.5 = 3.1 (3.1 x .3)= .93 REA adjustment = - 0.93 Step 3. KPH HCW = 725 Lbs. of KPH = 36.25 lbs 36.25/725= 5% 5% - 3.5% (base)= 1.5 % 1.5/.5 = 3 3 x .1 = .3 KPH adjustment = + 0.3 FINAL YIELD GRADE= 2.87
3 step method Summary LIVE Step 1. ESTIMATE Fat thickness FT= 0.6 0.6/0.1 = 6 6 x 0.25 = 1.5 adjustment 2.0 + 1.5 = 3.5 PYG Step 2. Determine Muscling and Adjust accordingly. For heavier muscled animals subtract from the Yield Grade. For lighter muscled animals add to the yield grade. Step 3. KPH Usually an animal will have 2.0 -3.5 % the fatter the animal normally the more KPH. Adjust after a guess. Or use a standard of – 0.2 adjustment.
Yield Grade 2 Adopted from: R.E. Taylor. Scientific Farm Animal Production. 4th Ed. 1992.
Yield Grade 5 Adopted from: R.E. Taylor. Scientific Farm Animal Production. 4th Ed. 1992.
Yield Grade 2 Yield Grade 5
Yield Grade 2 Yield Grade 5
Yield Grade 2 Yield Grade 5
Yield Grade 2 Yield Grade 5
Muscling Ribeye Round Sirloin Rib Chuck Quality Marbling, color Texture, firmness Trimness Ribeye Round Sirloin Short loin Loin edge Rib Chuck KPH Cod/udder Beef Carcass Terminology
Sample Questions on Beef Carcasses • Largest Ribeye? • Highest Marbling Score? • Trimmest over lower rib • Between __ & ___ displayed the most fat over the round? • Darkest Lean? • Plumpest Round? • Which carcass was displayed trimness, muscling and quality to the highest degree? • Between __& __ had the highest degree of marbling? • Which was the fattest opposite the ribeye? • Which carcass was the trimmest?