Download
1 / 17
170 likes | 313 Views
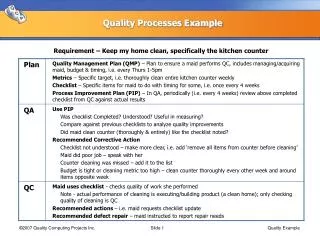
Leveraging Quality Processes In Technology Businesses. Satyendra Kumar Padmanabha Rao. Infosys Excellence Initiative 2000. 2001 - 9947 employees. 5. CMM Level 5 in 1999. 1999 - 4000 employees. CMM Level 4 in 1997. 1997 - 2500 Employees. ISO 9001 Certification. 1993 - 1000 Employees.

E N D
Leveraging Quality ProcessesIn Technology Businesses Satyendra Kumar Padmanabha Rao
Infosys Excellence Initiative 2000 2001 - 9947 employees 5 CMM Level 5 in 1999 1999 - 4000 employees CMM Level 4 in 1997 1997 - 2500 Employees ISO 9001 Certification 1993 - 1000 Employees Excellence @ Infosys
Management Processes Baldrige Framework Core Processes Leveraging CMM Level 5 Business Processes Six Sigma CFPM Infosys Excellence Initiative
2.5 Industry Average Industry Average Level 4 Companies Level 4 Companies 2 Reduction in Defect Injection 1.5 Industry Average Industry Average Defects / Person Hour Level 5 Companies Level 5 Companies 1 0.5 Infosys Infosys 0 Identify Common Identify Common Nov- Mar- Jul- Oct- Jul- Sep- May- Jan- Defect Types Defect Types 97 98 98 98 99 99 00 01 Implement Project Level Implement Prioritize Prioritize Monitor Results Organization Wide Monitor Results Find Solutions Find Solutions And Pilot And Pilot Reduction in Delivered Defects Defect Prevention
Improvements in Productivity Productivity (FP/p-mnth) Productivity (FP/p-month) Measure Caper Jones 2000 Productivity Benchmark 5 5 Caper Jones 2000 Productivity Benchmark Effectiveness Deploy 6 6 Jul- Sep- Nov- Jan- Mar- May- Jul- Sep- Nov- Jan- Mar- May- Jul- Sep- Nov- Jan- Mar- May- Jul- Sep- Nov- Jan- Mar- May- 99 99 99 00 00 00 00 00 00 01 01 01 4 4 99 99 99 00 00 00 00 00 00 01 01 01 1 1 2 2 Monitor PL Suggestions Enable Progress Deployment 7 6 Prioritize 5 Form Team Ratings on 7 point scale 4 Pilot 3 3 3 2 Value as Perceived by Customers 1 Honouring Delivering Partnering Value for Servicing commitments the promise money emerging needs Value Process Change Management
Reduce Project Cost Reduce Maintenance Cost Increase Productivity Robust Deployment Reduce Time To Market Reduce Life cycle Cost Strengthen Partnership Sustenance through Systems Increase Reliability Reduce Response Time Increase Predictability Variable Cost Productivity Customer Value Delivery Response CMM & Six Sigma: Components of Delivery Excellence
Partnering process definitions Leadership in process deployment Driving process evolution Senior Management Reviews Quality Department Delivery 80+ Practice Units 9947 SQA SEPG Delivery PSQA Internal 800+ Excellence Auditors 10+ 200+ Managers Process Council Working Groups for Process Definition 25+ WG1 WG2 WG3 WG4 WG n 250 Robust Deployment: ROFO - A Unique Approach Deployment is the responsibility of Delivery
Contract Management Resource Management Proposal Management Project Health Visibility Hierarchical Views On Line Tracking Project Budgeting Life Cycle Improvement Project Management Audit Management Defect Tracking Process Management Integrated Project Management System Transforming Intranet into a decision enabler
P r o d u c t i v i t y 2 0 0 0 P r o d u c t i v i t y 2 0 0 1 Effort - 5 - 2 5 0 2 5 5 0 7 5 1 0 0 1 0 - 1 0 0 0 1 0 0 2 0 0 3 0 0 Productivity increases by 10 % Variable costs decreases by 5 % Variable Cost 2001 Variable Cost 2000 Rework Review Testing Training U S L U S L 1 6 3 6 6 4 0 1 0 2 0 3 0 4 0 5 0 6 0 7 0 8 0 Variable Cost Productivity Supporting Cost Leadership ….
Schedule Slip % CY 2000 Delivered defects % CY 2000 Process Data USL 8.00000 Target * LSL 0.00000 Mean 8.84286 Sample N 77 St Dev (Overall) 11.3541 Observed Performance %<LSL 0.00 %>USL 35.06 %Total 35.06 Process Data USL 20.0000 Target * LSL 10.0000 Mean 19.6024 Sample N 103 St Dev (Overall) 35.5838 Observed Performance %<LSL 50.49 %>USL 32.04 %Total 82.52 LSL USL LSL USL 0 - 2 0 2 0 4 0 6 0 8 0 1 0 0 - 5 0 0 5 0 Schedule Slip % CY 2001 Sqrt of Delivered defects % CY 2001 Process Data USL 20.0000 Target * LSL 10.0000 Mean 3.7494 Sample N 25 St Dev (Overall) 13.1715 Observed Performance %<LSL 68.00 %>USL 12.00 %Total 80.00 Process Data USL 3.00000 Target * LSL 0.00000 Mean 1.81403 Sample N 15 St Dev (Overall) 1.23112 Observed Performance %<LSL 0.00 %>USL 20.00 %Total 20.00 LSL USL LSL USL -4 - 1 0 1 4 9 14 25 36 - 4 0 - 3 0 - 2 0 - 1 0 0 1 0 2 0 3 0 4 0 Mean delivered defects down to 3.8 % from 8.8% Mean schedule slip down to 3.7 % from 19.6% Reducing Total Cost of Ownership
Order through Receipt Process • Revenue gain > $ 1 Million • 15% Reduction in renewal time Define As-Is Develop Should-Be Select Process Detail Design Monitor Results Implement Process Motorola Six Sigma CFPM Process Business Process Excellence • Customer Relationship Process • Customer Management Skills • Relationship Management Process • Project Initiation Process • Talent Deployment Process • 96% Readiness In < 22 Days • 70% internal customers > satisfied
1000 1000 1000 750 750 750 500 500 500 Assessment Score Assessment Score Assessment Score 250 250 250 0 0 0 MBNQA 1 MBNQA 1 MBNQA 1 MBNQA 2 MBNQA 2 MBNQA 2 IMC Award IMC Award IMC Award 450 450 450 525 525 525 750 750 750 Scores Scores Scores IMC Ramakrishna Bajaj Award IMC Ramakrishna IMC Ramakrishna Bajaj Bajaj Award Award Guiding Evolution To World-Class Management Practices Infosys Leadership System Benchmarking - Jugalbandhi Customer Value Measurement Support Quality System Management Process Excellence
Satisfaction Rating APAC CAPS CENA ES ESCP EURP SONA WENA Customer Satisfaction Internal Partner Satisfaction Coming together to Deliver Customer Value
100% 100% 80% 80% 60% 60% Measures of customer loyalty Measures Of Customer Loyalty 40% 40% 20% 20% 100% 100% 0% 0% 1996 1996 1997 1997 1998 1998 1999 1999 2000 2000 80% 80% 60% 60% 40% 40% Customer more than satisfied Customer More Than Satisfied 20% 20% 0% 0% Met Needs Met Needs Recommend Recommend Consider Consider Better Better Voice of the Customer
Quality Process Consulting • A value added service for key customers • To strengthen selected customer relationships • Based on actual implementation experience • A testimonial of customer confidence in Infosys quality
Management Processes Baldrige Framework Core Processes Leveraging CMM Level 5 Business Processes Six Sigma CFPM To Summarize