Download
1 / 51
510 likes | 696 Views
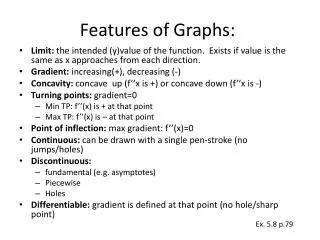
Features of Graphs of Functions. Thinking with your fingers. Terminology. Increasing – As your x finger moves right, your y finger moves up. Decreasing – As your x finger moves right, your y finger moves down Constant – As your x finger moves right, your y finger does not move

E N D
Terminology • Increasing – As your x finger moves right, your y finger moves up. • Decreasing – As your x finger moves right, your y finger moves down • Constant – As your x finger moves right, your y finger does not move Because x is the independent variable, increasing/decreasing/constant intervals are described in terms of values of x
Interval Notation Increasing on (2,∞) Increasing on (-∞,-2) Decreasing on (-2,2)
Extrema and Local Extrema • The maximum of a graph is its highest y value. • The minimum of a graph is its lowest y value. • A local maximum of a graph is a y value where the graph changes from increasing to decreasing. (Stops getting bigger) • A local minimum of a graph is a y value where the graph changes from decreasing to increasing (Stops getting smaller) • These extrema are all y values. But because x is the independent variable, they are often described by their location (x value).
Extrema No maximum, or maximum of ∞ Local maximum of ƒ(x)=5.3333 at x=-2 Local minimum of ƒ(x)=-5.3333 at x=2 No minimum, or minimum of -∞
Using your graphing utility, graph the function below and determine on which x-interval the graph of h(x) is increasing:
Using your graphing utility, graph the function below and determine on which x-interval the graph of h(x) is increasing:
The Bank Problem • Frances puts $50 in a bank account on Monday morning every week. • Draw a graph of what Frances's bank account looks like over time. Put number of weeks on the horizontal axis, and number of dollars in her account on the vertical axis.
Piecewise function • Function definition is given over interval “pieces” • Ex: • Means: “When x is between 0 and 2, use the formula “2x+1.” When x is between 2 and 5, use the formula “(x-3)2”
Example • Find ƒ(3) • Check the first condition: 0≤3<2? FALSE. • Check the second condition: 2≤3<5? TRUE. • Use (x-3)2 • (3-3)2=02=0 • ƒ(3)=0
Example For the interval of x [0,2) draw a graph of 2x+1 For the interval of x [2,5) draw a graph of (x-3)2
Example For the interval of x [0,2) draw a graph of 2x+1 For the interval of x [2,5) draw a graph of (x-3)2
Consider the piecewise function below: Find h(3). • 7 • -2 • -3 • Both (a) and (b) • None of the above
Consider the piecewise function below: Find h(3). • Check first condition: 3>5? FALSE • Check second condition: 3≤5? TRUE • Use x-5 • 3-5=-2 • B) -2
Combining Functions (Algebra of Functions)
Things to remember • Function notation • ƒ(x)=2x-1 is a function definition • x is a number • ƒ(x) is a number • 2x-1 is a number • ƒ is the action taken to get from x to ƒ(x) • Multiply by 2 and add -1
Things to remember • Function notation • ƒ(x)=2x-1 is a function definition • 3 is a number • ƒ(3) is a number • 2*3-1 is a number (it’s 5) • ƒ is the action taken to get from 3 to ƒ(3) • Multiply by 2 and add -1
When I add and multiply the results of functions, I create a new function f(x) f x f(x)+g(x) + g g(x)
When I add and multiply the results of functions, I create a new function f(x) f x f(x)+g(x) + g g(x)
I can give this new function a name f+g x f(x)+g(x)
I can give this new function a name f+g x f(x)+g(x) • The function f+g is the action: • Do f to x. get f(x) • Do g to x. get g(x) • Add f(x)+g(x)
Example 2x f x 2x+3x + g 3x
Example 2x f x 5x + g 3x
Example f+g x 5x
Notation • (f+g)(x)=f(x)+g(x) • (f-g)(x)=f(x)-g(x) • (fg)(x)=f(x)*g(x) • (f/g)(x)=f(x)/g(x), g(x)≠0
WARNING (fg)(x) and f(g(x)) are not the same thing • (fg)(x) means “do f to x, then do g to x, then multiply the numbers f(x) and g(x).” • f(g(x)) means “do g to x, get the number g(x), then do f to the number g(x)” • No multiplying. • We will talk more about f(g(x)) next time.
Example • Find (g/f)(-2)
Graphing sums • Function ƒ has a graph. • Function g has a graph • Function (ƒ+g) also has a graph. • Can I find the graph of (ƒ+g) from the graphs of ƒ and g? • Hint: the answer is yes.
Given the function definitions below: Find (ƒ+g)(3). • -11 • 3 • 0 • -21 • None of the above