Download
1 / 28
280 likes | 366 Views
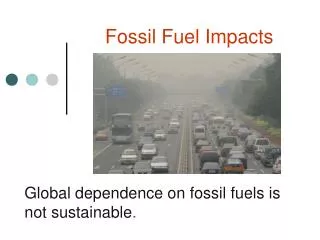
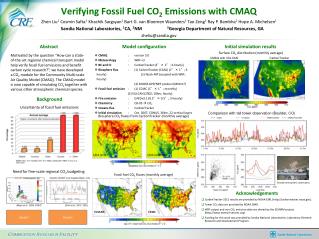
An attempt to quantify fossil fuel CO 2 over Europe. Ute Karstens 1 , Ingeborg Levin 2. 1 Max-Planck-Institut für Biogeochemie, Jena 2 Institut für Umweltphysik, Universität Heidelberg. How large is the contribution from fossil fuels to the amount of CO 2 in the atmosphere?.

E N D
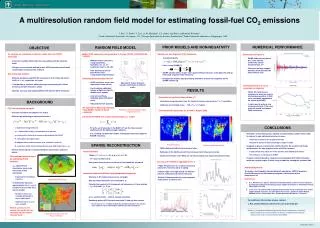
An attempt to quantify fossil fuel CO2 over Europe Ute Karstens1, Ingeborg Levin2 1 Max-Planck-Institut für Biogeochemie, Jena 2 Institut für Umweltphysik, Universität Heidelberg
How large is the contribution from fossil fuels to the amount of CO2 in the atmosphere? … from a modeller’s perspective
-10 0 10 20 30 40 50 February CO2 Fluxes Fossil fuel CO2 (EDGAR V3.2 FT, Olivier et al., 2005) Biome-BGC NEE (Churkina et al., 2003) annual mean 2000 February 2002 10-9 kg C m-2 s-1
Fossil fuel experiment Objective: Assess the impact of new « hourly estimates » of fossil fuel emissions over Europe at continental sites using different transport models • Inventories: • TransCom 3 • EDGAR ft 2000 yearly • EDGAR ft 2000 hourly • IER 2000 hourly • Models: • LMDz • TM5 • TM3 • DEHM • REMO
Jan Feb Mar Apr May Jun Jul Aug Sep Oct Nov Dec 2002 Fossil fuel experiment
How to measure fossil fuel CO2in the atmosphere? —› Radiocarbon (14C) in atmospheric CO2 … … because fossil fuel CO2 contains no 14C and dilutes atmospheric 14CO2
14CO2 monitoring sites in (Carbo)Europe Mace Head Lutjewad Paris Heidelberg Schauinsland Krakow Jungfraujoch Kasprowy REMO mean european fossil fuel CO2 in January 2002 at 130m [ppm]
Comparison with REMO 20 15 10 5 0 20 15 10 5 0 35 30 25 20 15 10 5 0 35 30 25 20 15 10 5 0 CO2 fossil fuel [ppm] CO2 fossil fuel [ppm] 5 4 3 2 1 0 5 4 3 2 1 0 35 30 25 20 15 10 5 0 35 30 25 20 15 10 5 0 Measured CO2(foss) mixing ratio Data provided by R. Neubert (Lutjewad) and K. Rozanski (Krakow)
jfj jfj tvr tvr hei hei pal pal prs prs sch sch hun hun cbw cbw mhd mhd Measured CO2(foss) mixing ratio Comparison with models TM3 LMDZ HANK DEHM REMO OBS JULY – 1998 DECEMBER – 1998 20 15 10 5 0 -5 12 10 8 6 4 2 0 -2 CO2 fossil fuel [ppm] Geels et al., 2005, CO2 model comparison
14C is an excellent tracer for fossil fuel CO2 … but the network of 14C measurements is sparse: 8 - 10 stations across Europe … and the temporal resolution is poor: weekly means
—›proxies/surrogates needed to substitute 14CO2 observations Carbon Monoxide (CO)
EDGAR V3.2 FT 2000 (Olivier et al., 2005) IER mean 2000 (Scholz et al., IER 2005) mmol / mol 0 10 20 30 40 50 60 hourly emissions on 50 km x 50 km grid annual mean emissions on global 1°x1° grid CO/CO2 fossil fuel emission ratios 2000
Comparison of measured and REMO-modelled atmospheric CO and CO2(foss) CO and CO2(foss) corrected with 222Rn(obs)/222Rn(mod)
Comparison of measured and REMO-modelled CO/CO2(foss) ratios Mean ratios [ppb/ppm]: Observations: 13.5±2.5 REMO & EDGAR: 12.7±0.6 REMO & IER: 11.0±0.8 CO2(foss)corr RMSE [%] REMO & EDGAR: 21.4 REMO & IER: 42.7
Conclusions (I): • Fossil fuel CO2 emissions in Europe contribute almost half to the continental CO2 signal. • Monthly mean fossil fuel CO2 levels at urban sites can be determined by high precision 14CO2 measurements to better than ±10% in winter and about ±30% in summer. • At remote sites, the mean fossil fuel CO2 signal is small (1-5 ppm) and can be determined by 14CO2 measurements only to about 30%. • 14C-derived fossil fuel CO2 at selected stations is needed to validate emissions inventories and assess model estimates of fossil fuel CO2.
Conclusions (II): CO is a potentially applicable surrogate tracer for fossil fuel CO2, however, • Emissions inventories of CO and fossil fuel CO2 are yet not accurate enough to apply it quantitatively, • Non-fossil CO sources, in particular soil emissions and their temporal variations, strongly influence the results and need to be estimated more accurately, • The catchment area and relative mix of emissions needs to be known accurately, this requires modelling, • Validation at a larger number of sites is necessary e.g. at one site per country, at least in Europe.
Radiocarbon 14C (14C, radioactive life time t= 8300 years) Natural 14C production by reactions of neutrons from cosmic radiation with atmospheric Nitrogen natural atmospheric background level Artificial 14C production via atmospheric nuclear weapon tests in the 1950s and 1960s „Negative 14C source“ via burning of fossil fuels and cement production
Long-term 14CO2 observations in Europe „clean“ D14CO2 background level in the Alps Suess effect bomb tests Depletion of the D14CO2 level close to fossil fuel sources
Monthly mean fossil fuel CO2 at Schauinsland station and in Heidelberg mean fossil fuel CO2 offset: Schauinsland: ca. 1.4 ppm Heidelberg: ca. 10 ppm
Regional Atmospheric Model REMO • 0.5° x 0.5° horizontal resolution • 20 vertical layers • Semi-hemispheric model domain (> 30°N) • Online tracer transport • Prescribed emissions and surface fluxes • Parameterization of CO chemistry • Initial and lateral boundary conditions: Metorology: ECMWF analyses CO: MOZART global CTM (Horowitz et al., 2003) CO2: TM3 global transport model (Heimann and Körner, 2003)
Surface fluxes used in REMO • CO Emissions • Fossil fuel burning (EDGAR V3.2 extrapolated) • Fossil fuel burning in Europe (IER 2000, extrap.) • Fuelwood burning (EDGAR V3.2) • Agricultural waste burning (EDGAR V3.2) • Biomass bruning (Hao and Liu, 1994) • Soil emission (Müller, 1992) • Ocean emission (Brasseur et al., 1998) • CO2 Surface fluxes • Fossil fuel burning (EDGAR V3.2 extrapolated) • Fossil fuel burning in Europe (IER 2000, extrap.) • Terrestrial Biosphere Model BIOME-BGC (Churkina et al., 2003) • Ocean fluxes (Takahashi et al., 1999)
Comparison of measured and REMO-modelled CO/ffCO2 ratios Mean ratios [ppb/ppm]: Observations: 13.5±2.5 REMO & EDGAR: 12.7±0.6 REMO & IER: 11.0±0.8 EDGAR (only FF): 11.2 IER (only FF): 12.4
Comparison of measured and REMO-modelled CO/CO2(foss) ratios EDGAR(only foss): 34.4 IER(only foss): 28.8 Mean ratios [ppb/ppm]: Observations: 13.5±2.5 REMO & EDGAR: 12.7±0.6 REMO & IER: 11.0±0.8 CO2(foss)corr RMSE [%] REMO & EDGAR: 21.4 REMO & IER: 42.7
Comparison with REMO 5 ppm 20 ppm Measured CO2(foss) mixing ratio 35 ppm 35 ppm Data provided by R. Neubert (Lutjewad) and K. Rozanski (Krakow)