Download
1 / 49
560 likes | 910 Views
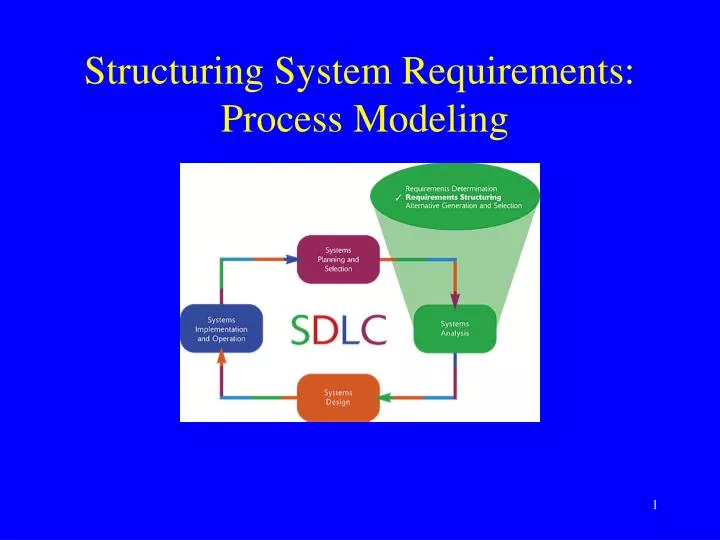
Structuring System Requirements: Process Modeling. Requirements Structuring in SDLC. Introduction. Purpose => clearly and coherently represent information about the system obtained during requirements determination Model How information flows through the system

E N D
Introduction • Purpose => clearly and coherently represent information about the system obtained during requirements determination • Model • How information flows through the system • What relationships between data flows exist • What processes transform the data • Where data is stored
Process Modeling • Graphical representation of processes that transform data • DFD - graphical tool that models flow of data in an information system • Structured analysis techniques • Hierarchical • First of three perspectives for system modeling
Process Modeling • Input - requirements gathering • Output/deliverables • 2-4 DFDs (Context -level, Level-0, others) • Logical models (DFDs) • Close match to Use Case models • Physical DFDs replaced with Use Case Diagram and Use Case Narratives in our class
Figure 8-13a Physical Context Diagram Figure 8-13b Physical Level-0
Figure 8-15 Current Logical Level-0 Diagram Figure 8-16 Proposed Logical Level-0 Diagram
Process Data flow Data store External entity Elements of a Data Flow Diagram
Process • Actions performed on data that transforms it in some way • Above the line is a number that indicates the process number and level • Labeled with a verb phrase • Must change or manipulate the data in some way therefore must have an input and an output • Close correspondence to Use Cases
Data Flow • Line & arrow • Data in motion (arrow indicates direction of flow) • Data that moves together (general name of a business form) • Labeled with a noun phrase • Close correspondence to inputs and outputs in Use Case Diagram
Data Store • Data at rest • Physical locations • Labeled with a noun phrase • Must interact with a process • Often databases or database tables
Data Source/Sink • Source of data from environment to system or destination of data from system to environment (i.e. OUTSIDE the system) • Can be person, system, organization, etc. • Labeled with a noun phrase • Black boxes from our perspective • All systems must have one source and one sink • Also called External Entities • Close correspondence with Actors in Use Case models
Data Sources/Sink Rules • Ignore: • Interactions between sources and sink • Processes that occur within a source or sink • Designs or controls for them • Do not allow direct access from one of these to any data store within your system
Figure 8-3a Incorrect Data Source/Sink Rules Figure 8-3b Corrected
Level-0 Context Level-1 Level-2
Context Level Level-0 Level-1 Same as previous Just different style Level-2
Level 0 diagram Level 2 diagram Context diagram Level 1 diagram
Context Level Diagram • Strong relationship between your Use Case Diagram and this DFD • Always the 1st DFD • Always has just one process (0 process) • Must have at least 1 external entity (shows all if more than 1) • Must have at least 1 input and 1 output dataflow (shows all inputs and outputs)
Level 0 Diagram • 1st step in decomposition (from context level diagram) • Shows all main processes – should be a close correlation to your essential Use Case Narratives • First level where data stores are added • Shows external entities and all major processes they interact with • Shows relationships between major processes
Relationship Between Use Case Narratives and DFDs
Level 1 DFDs • 2nd step in decomposition process • Generally 1 for each major process on Level 0 DFD • Shows all internal processes for a single Level 0 process • Shows information flows • Children processes must wholly & completely make up parent process • Most will have a detailed Use Case Narrative
Level 2 DFDs • 3rd step in decomposition process • Not one for every Level 1 process only those that need it • Shows information flows • Correct numbering important
Alternative Data Flows • When a process can produce different outputs given different conditions • Show both in DFD • Use Logic Models (process descriptions) to explain • Typically associated with IF-THEN-ELSE or CASE (decisions or choices)
Process Relationships • Tightly coupled processes - no data stores between them • Decoupled processes - data stores between processes Tightly Coupled Processes Decoupled Processes
DFD Diagramming Rules Know for the Final!!!
Common DFD Errors
General DFD Guidelines • Inputs to a process must be different from outputs of a process • DFD objects must have unique names • Functional decomposition - going from highest level deeper and deeper into more detail (each level on its own page) • Balancing - conservation of inputs and outputs
Steps in Building DFDs • Build context DFD (from use case diagram) • Create DFD fragment for each essential Use Case Narrative • Organize DFD fragments into Level 0 DFD • Decompose level 0 processes into level 1 DFDs and level 1 processes into level 2 DFDs as needed • Validate • Iterate
Figure 8-4 Context Level Diagram Hoosier Burger’s Food Ordering System Figure 8-5 Level-0 Diagram
Decomposition of Process 1.0 Hoosier Burger’s Food Ordering System
Decomposition of Process 4.0 From the Level-0 Diagram Level-2 Level-1 Level-0
Context Level Level-0 Level-1 Decomposition Process Level-2
Validating the DFD • Syntax errors – diagram follows the rules • Assure correct DFD structure • For each DFD: Check each process for: A unique name: action verb phrase; number; description • At least one input data flow • At least one output data flow • Output data flow names usually different thaninput data flow names • Between 3 and 7 processes per DFD
Validating the DFD For each DFD:Check each data flow for:A unique name: noun; description Connects to at least one process Shown in only one direction (no two-headed arrows) A minimum number of crossed lines Check each data store for: A unique name: noun; description At least one input data flow At least one output data flow Check each external entity for: A unique name: noun; description At least one input or output data flow
Validating the DFD Across DFDs: Context Diagram: Every set of DFDs must have one Context Diagram Viewpoint: There is a consistent viewpoint for the entire set of DFDsDecomposition: Every process is wholly and complete described by the processes on its children DFDsBalance: Every data flow, data store, and external entity on a higher level DFD is shown on the lower level DFD that decomposes it No data stores or data flows appear on lower-lever DFDs that do not appear on their parent DFD
Validating the DFD • Semantics errors – diagram conveys correct meaning • Assure accuracy of DFD relative to actual/desired business processes • To verify correct representation, use • User walkthroughs • Role-play processes • Examine lowest level DFDs to ensure consistent decomposition • Examine names carefully to ensure consistent use of terms
Advanced DFD Guidelines • Composite data flows can be broken into component data flows • Inputs must be sufficient to produce outputs • Exception messages at primitive DFD level can be new • Can repeat external entities to avoid messiness
* * An Example of Repeating External Entities to Avoid Crossed Lines and Messiness
More Guidelines • Completeness - all necessary components are modeled correctly and fully described • Consistency - balanced DFDs • Timing - DFDs are drawn as if in perpetual motion • Iterative - lower level rule of thumb 3 revisions
DFDs - Stop When: • Reach lowest logical level • Each data store represents a single entity • Each process is a single decision, calculation or database operation • Users doesn’t want more detail • Detail is good enough for spec development • Data flows can’t be split any further • A separate process for each lowest level menu exists
List 3 Errors (DFD Rule Violations) For this set of DFDs
Any Errors?? Note Source And Destination Information on Data Flows