Download
1 / 12
120 likes | 253 Views
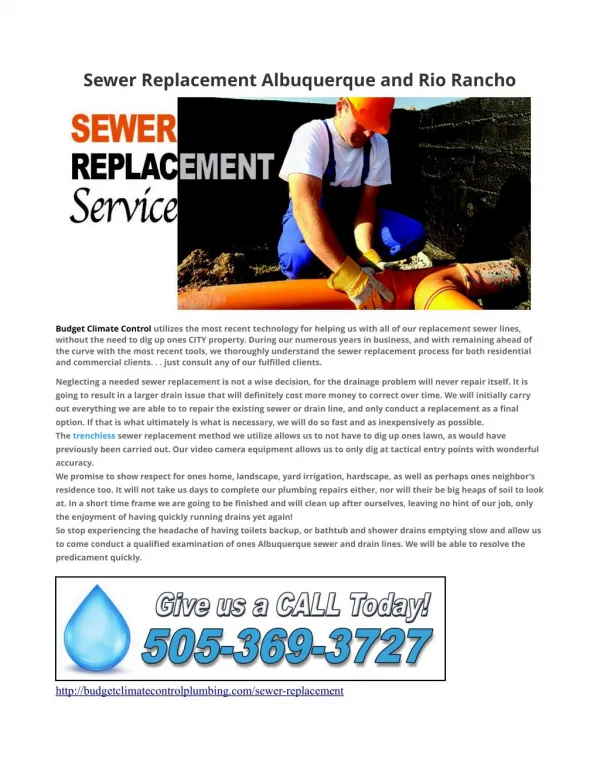
Gull Lake Sewer + Water Authority Workshop. Cost Centers + Expenses Overview (Additional information) . Cost Center Overview Acct 675: Treatment Costs, Flows + Authority Rate (accounts for 40%-50% of annual expense). In 2002, our ‘bulk rate’ was $0.228 per cubic meter ($0.86 /1000 gallons)

E N D
Gull Lake Sewer + Water Authority Workshop Cost Centers + Expenses Overview (Additional information)
Cost Center OverviewAcct 675: Treatment Costs, Flows + Authority Rate(accounts for 40%-50% of annual expense) • In 2002, our ‘bulk rate’ was $0.228 per cubic meter ($0.86 /1000 gallons) • In 2012, our ‘bulk rate’ was $0.487 per cubic meter ($1.84/1000 gallons) • For 2013, our ‘bulk rate’ is $0.504 per cubic meter ($1.91 per 1000) • This represents 121% increase (2.21 multiplier) overall – 11 years • This represents a 3.5% increase over last year. And continued 3.5% annual increases projected. • From 2002-2011, our flows have increased, especially 2008 –current, due to higher ground water tables (Clean water elimination needed) • Flows in 2002 = 400,000 gal/day; Flows in 2012 = 750,000 gal/day* • *Industrial flows + Purge water flows included • Over this time frame, our rates to customers have increased twice: • 1985-2005: Rate was $18.33 per unit (home) – no increases • 2005: From $18.33 per unit (home) in 2002 to $20.00 per unit • 2008: From $20.00 per unit (home) to $21.67 per unit • 18% overall increase over 10 years to our customers
Authority Reserve Levels - from FYE 3/31/2011 Audit (Critical Risk Assessment for Major Transmission / Capacity Reserves = $0.5 - $1 Million) • Sherman Lake (Cash funded--covered by Conn Fees) $ 63,454 • Little Long Lake (Debt Issued + Cash--covered by Asm’ts) $ 22,682 • Gull Island (Debt Issued + Cash – covered by Assessments) $ 27,289 • B0ard Reserved for Working Capital $ 202,765 • Board Reserved for Capital Improvements $ 533,847 • Board Reserved for Scheduled Replacements $ 574,669 • Miscellaneous – other $ 48,621 (Office + Driveway Completed) fye 2011 total $1,473,427 • (Office + Driveway Renovations ) fye 2010 total $1,404,869 (net of working capital) • fye 2009 total $1,600,401 (net of working capital) • fye 2008 total $1,257,497 (net of working capital)
Treatment Costs - Kalamazoo • FYE 2004 - $194,430 audited • FYE 2005 - $272,050 audited • FYE 2006 - $341,741 audited • FYE 2007 – $322,502 audited • FYE 2008 – $380,131 audited • FYE 2009 – $526,025 audited • FYE 2010 - $459,698 audited • FYE 2011 - $516,541 audited • FYE 2012 - $499,602 projected as of 3/31/2012 • FYE 2013 - $540,000 budgeted for 3/31/2013 • Summary: Treatment costs increased 12.4% annually
Cost Center OverviewAcct 530: Health Insurance (includes reimbursables + Part time insurance coverage) • FYE 2004 - (3) 2-person (2p) • FYE 2005 - (3) 2-person (2p) • FYE 2006 - (2) 2p + (1) single • FYE 2007 - (2) 2p + (1) single • FYE 2008 – (2) 2p + (1) single • FYE 2009 – (2) 2p + (1) single • FYE 2010 - (2) 2p + (2) single • FYE 2011 - (2) 2p + (2) single • FYE 2012 - (2) 2p + (2) single • FYE 2013 - (1) fam + (1) 2p + (2) single • $34,135 audited • $41,657 audited • $38,925 audited • $44,926 audited • $42,678 audited • $49,310 audited • $57,211 audited • $57,349 audited • $62,380 projected 3/31/2012 • $37,200 budgeted 3/31/2013
Acct: Salaries + Wages • FYE 2004 - $189,603 audited • FYE 2005 - $212,097 audited • FYE 2006 - $225,448 audited • FYE 2007 – $229,646 audited • FYE 2008 – $250,712 audited • FYE 2009 – $250,230 audited • FYE 2010 - $254,478 audited • FYE 2011 - $251,078 audited • FYE 2012 - $264,540 projected(includes $15,000 H.S.A contrib) • FYE 2013 - $284,000 budgeted (H.S.A. adjusted + $10,000 new hire)
Contracted Services (includes Treatment Cost to K’zoo) • FYE 2004 - $281,103 ($194,430) audited • FYE 2005 - $365,628 ($272,050) audited • FYE 2006 - $427,310 ($341,741) audited • FYE 2007 – $421,900 ($322,502) audited • FYE 2008 – $487,712 ($380,131) audited • FYE 2009 – $642,856 ($526,025) audited • FYE 2010 - $575,969 ($459,698) audited • FYE 2011 - $592,650 ($516,541) audited • FYE 2012 - $606,340 ($499,602) projected as of 3/31/2012 • FYE 2013 - $643,325 ($540,000) budgeted for 3/31/2013
Acct: Utilities : FUEL + ELEC + GAS + TELEPHONE • FYE 2004 - $42,096 audited • FYE 2005 - $45,925 audited • FYE 2006 - $42,411 audited • FYE 2007 – $53,479 audited • FYE 2008 – $56,216 audited • FYE 2009 – $63,610 audited • FYE 2010 - $65,795 audited • FYE 2011 - $68,440 audited • FYE 2012 - $69,321 projected as of 3/31/2012 • FYE 2013 - $78,000 budgeted for 3/31/2013
Operations, Maintenance + Repairs • FYE 2004 - $30,341 audited • FYE 2005 - $25,724 audited • FYE 2006 - $26,695 audited • FYE 2007 – $31,488 audited • FYE 2008 – $28,179 audited • FYE 2009 – $35,616 audited • FYE 2010 - $28,612 audited • FYE 2011 - $66,502 audited • FYE 2012 - $80,457 projected as of 3/31/2012 • FYE 2013 - $86,000 budgeted for 3/31/2013