Download
1 / 50
500 likes | 610 Views
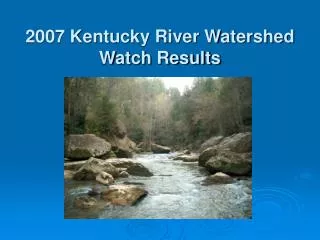
2007 Kentucky River Watershed Watch Results. What and when? . Herbicides in the Spring 23 samples in May + 30 nutrient samples in Eastern Kentucky Pathogens in the Summer 161 Synoptic samples in late June 109 Follow-Up samples in Late July Chemicals & Nutrients in the Fall

E N D
What and when? • Herbicidesin the Spring • 23 samples in May + 30 nutrient samples in Eastern Kentucky • Pathogensin the Summer • 161 Synoptic samples in late June • 109 Follow-Up samples in Late July • Chemicals & Nutrientsin the Fall • 177 samples in September • Metalsin the Fall • 69 samples in September
Where? 223 sites throughout Kentucky River Basin 3% Lower Kentucky River Basin 5% Eagle Creek 20% Elkhorn Creek Watershed 34% Palisades 8% Dix River Watershed 2% Middle Kentucky / Red River Basins 0% South Fork Kentucky River Basin 1% Middle Fork Kentucky River Basin 26% North Fork Kentucky River Basin
2007 KRWW Sampling Sites (223 total) 2006 KRWW Sampling Sites 2006 KRWW Sampling Sites 2006 KRWW Sampling Sites
HERBICIDES Why monitored? • Potentially harmful to aquatic life and humans through drinking water Where are they coming from? • Runoff from agricultural and residential application How can we minimize their presence in our waterways? • Apply only as absolutely necessary, follow application instructions. • Maintain vegetation around and along waterbodies. • Use recommended agricultural erosion control practices. • Properly dispose of herbicide containers (collection programs) • Do not dump leftover herbicide on ground, down sink, or down stormwater drains.
2006 Herbicide Parameters Sampled for 2 herbicides in Spring 2006 • most likely time of year for herbicide application Triazines • highly persistent in soil • EPA standard of 3.0 micrograms /L for drinking water • 350 micrograms/L for acute aquatic life criteria • 12 micrograms/L for chronic aquatic life criteria Metolachlor • highly persistent in water • unregulated by EPA
Herbicide Results Triazines NOT detected Metolachlor found at 5 sites, the greatest being: K558 (Mock’s Creek) – 0.08 micrograms/liter (laboratory MCL was 0.08 ug/L for Metolachlor)
2007 Herbicide Sampling Results 2006 Herbicide Detections K501 – Eagle Creek Herbicides detected Herbicide sampling site
FECAL COLIFORM / E. COLI Why monitored? • Can indicate presence of other pathogens that may cause illness or infections in people. Where are they coming from? • Failing septic systems, straightpipes, leaking sewage lines • Inadequately treated discharge from municipal sewage plants • Livestock (runoff from pasture or direct access to waterbody) How can we minimize their presence in our waterways? • Properly maintain septic systems • Increase access to sewer systems • Install fencing to keep livestock out of waterways • Maintain vegetated buffers around waterbodies
Pathogen Parameters Fecal Coliform • Swimming Standard of 400 cfu/100 ml (instantaneous) E. Coli • Swimming Standard of 240 cfu/100 ml (instantaneous) Atypical/Typical Coliform Ratio • Ratio between 0 and 2 raw, human sewage • Ratio between 2 and 4 fresh, human/ag • Ratio between 5 and 10 indirect, ag • Ratio between 10 and 20 indirect, urban • Ratio greater than 20 aged, human/ag
Synoptic Pathogen Results (Fecal coliform)52%> Swimming Std.
Synoptic Pathogen Sampling Sites > 5,000 cfu/100 ml 2006 Synoptic Pathogen Sampling Results > 5,000 cfu/100 ml
Follow-Up Pathogen Results (Fecal coliform)96% > Swimming Std.
Focused Pathogen Sampling • Cane Run, Scott Co. (2 sites) • Glenn’s Creek, Woodford Co. (4 sites) • White Oak Creek, Garrard Co. (2 sites) • Herrington Lake (6 sites) • North Fork Ky. River, Letcher Co. (13 sites)
2007 Focused Pathogen Sampling Sites Cane Run White Oak Creek Glenn’s Creek Herrington Lake North Fork Kentucky River
Focused Pathogen Results Cane Run – geometric mean for 2/2 sites > PCR std. Glenn’s Creek – 4/4 sites > std. White Oak Creek – 1/2 sites > std. Herrington Lake – 0/6 sites > std. North Fork Ky River – 11/13 sites > std. PCR = primary contact recreation (swimming/wading)
NUTRIENTS Why monitored? • Lead to algal blooms, which consume oxygen as they decompose bad for aquatic life • Cause taste and odor problems in drinking water • Can cause “Blue baby” disease (or methemoglobinemia) Where are they coming from? • agricultural and residential fertilizer application • sewage and manure runoff How can we minimize their presence in our waterways? • Only apply fertilizers as necessary • Properly maintain septic systems • Use recommended erosion control measures • Keep livestock out of waterways, properly manage manure • Maintain vegetated buffers around waterbodies
Nutrient Parameters Nitrate (NO3-N) • Drinking Water Supply Std. = 10 mg/L Total Phosphorus • Unofficial KRWW Aquatic Life Std. = 0.5 mg/L Sulfate • Drinking Water Supply Std. = 250 mg/L
Nitrate Results > 10 mg/L K085 / K126 – Glenn’s Creek (19.2 /13.4 mg/L) K209 / K515– Tates Creek (15.5 / 11 mg/L) K123 / K026 – S. Elkhorn Creek (14.6 / 14.2 mg/L) K303 – Hickman Creek (13.7 mg/L) K030 – Ten Mile Creek (11.4 mg/L) K014 – Clark’s Run (11.1 mg/L)
2007 High Nitrate Sites 2006 High Nitrate Site K499 – Town Branch
Phosphorus Results > 1 mg/L K209 / K515 / K530 – Tates Creek, Madison Co. (2.1 / 1.8 / 1.0 mg/L) K085 – Glenn’s Creek, Woodford Co. (1.9 mg/L) K120 – UT to Elkhorn Creek, Woodford County (1.7 mg/L) K123 / K026 – S. Elkhorn Cr. (1.7 / 1.6 mg/L) K191 – Otter Creek (1.6 mg/L) K408 – Kentucky River (1.4 mg/L) K030 – Ten Mile Creek (1.3 mg/L) K529 – Elkhorn Creek (1.1 mg/L) K556 – Cane Run (1.1 mg/L)
2007 High Phosphate Sites 2006 High Phosphorus Sites
Sulfate Results Ten Greatest Sulfate Results: K542 / K578 – Sandlick Creek, Letcher Co.(1,990 / 1,850 mg/L) K216 – Troublesome Creek(1,610 mg/L) K536 – Long Branch(1,600 mg/L) K215 – Lost Creek(1,590 mg/L) K483 – Henry Ison Hollow(1,490 mg/L) K579 – Cane Hollow(1,490 mg/L) K535 – Sturgill Branch(1,370 mg/L) K447 – Cowan Creek(1,260 mg/L) K083 – Lotts Creek(1,220 mg/L)
2006 High Sulfate Sites 2007 High Sulfate Sites
HEAVY METALS Why monitored? • High levels can be toxic to aquatic life or humans through drinking water • Can interfere with industrial water uses Where are they coming from? • Mining • Industrial discharges • Stormwater runoff from roads and parking lots How can we minimize their presence in our waterways? • Comply with discharge permit conditions • Use erosion control measures at mining sites and other construction sites • Install retention ponds, vegetated filter strips around parking lots and along roads (stormwater management practices)
Aluminum Antimony Arsenic Barium Beryllium Boron Cadmium Calcium Chromium Cobalt Copper Gold Iron Lead Lithium Magnesium Manganese Nickel Phosphorus Potassium Selenium Silicon Silver Sodium Strontium Sulfur Thallium Tin Vanadium Zinc Metal Parameters (30) * Strikethrough = no detections 20 of 30 remaining
Antimony – no detections * Barium * Nickel * Beryllium Selenium – no detections * Chromium Silver – no detections * Copper Thallium – no detections * Iron * Zinc Lead – no detections * Manganese Metal Parameters with Standards (13)
2007 Sites of Concern OVERALL WATER QUALITY: K085 - Glenn’s Creek, Woodford Co. (also in 2006) pathogens, nitrogen phosphorus K191 – Otter Creek, Madison Co. (K338 in 2005 & 06) pathogens, nitrogen, phosphorus NUTRIENTS: K026 – South Elkhorn Creek, Scott Co. K030 – Ten Mile Creek, Grant Co. K209 / K515 – Tates Creek, Madison Co.
2007 Sites of Concern (continued) PATHOGENS: K116 – Blair Branch, Letcher Co. K215 & K216 - Lost Creek, Breathitt Co.(also in 2005 & 06) also have high sulfate readings K264 – Unnamed tributary, Madison Co. K288 – Troublesome Creek, Knott Co. K448 / K554 – Cowan Creek, Letcher Co.
2007 Sites of Concern (continued) METALS / SULFATE: K447 – Cowan Creek, Letcher Co. K536 – Long Branch, Letcher Co. (also in 2006) K542 / K578 – Sandlick Creek, Letcher Co. (also in 2006) K579 – Cane Hollow, Letcher Co.
2006 KRWW Sites of Concern 2007 Sites of Concern
Historically Troubled Streams Glenn’s Creek, Woodford Co. Long Branch, Letcher Co. Lost Creek, Breathitt Co. Otter Creek, Madison Co. Rocky Fork, Garrard Co. Sandlick Creek, Letcher Co. Tates Creek, Madison Co. Ten Mile Creek, Grant Co. Town Branch, Fayette Co. Troublesome Creek, Knott Co. Wolf Run, Fayette Co.
KRWW ONLINE DATABASEhttp://www.krww.org Volunteers Fast, easy access to all data Data Manager Data updates made easier Common, shared database (less confusion / errors) Volunteer Coordinator Easy addition of new sites Automatically calculates lat/long info when entered
WEBSITE FEATURES • Zoom in past 1:500,000 to see site ID labels Click on site or sites to see all historical data • Use “Area Tool” to zoom to single site or group of sites • Use “Measure Tool” to find distance between 2 points Use “Zoom to a Location” to zoom to a selected location (county, road intersections, stream extents, etc.)
Kentucky River Authority Watershed Grant Program Grant offerings of up to $3,000 for watershed education, sampling, assessment, restoration projects Applicants must be nonprofit organization, school, or local government Applications will be accepted again in Fall ’08