Download
1 / 22
310 likes | 715 Views
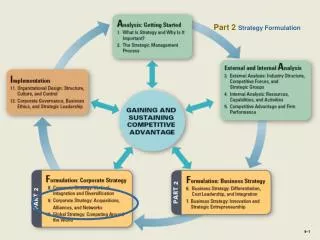
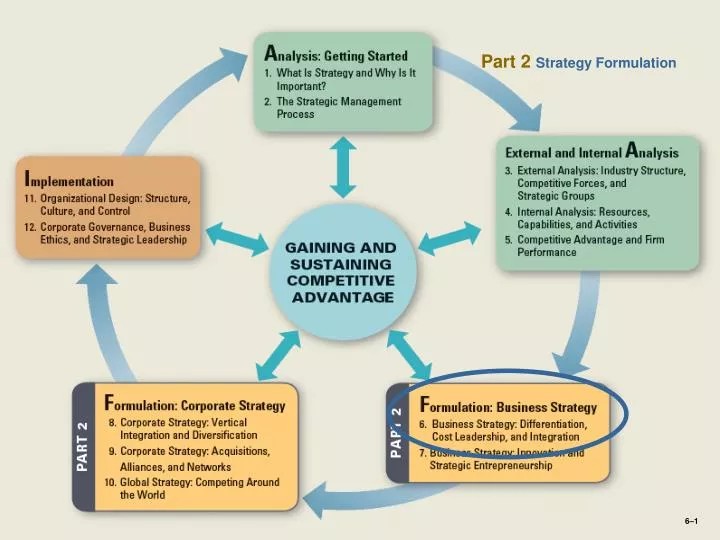
Part 2 Strategy Formulation. Industry and Firm Effects Jointly Determine Competitive Advantage. EXHIBIT 6.1. Strategic Position. Determined by Firm’s Business-Level Strategy Two primary competitive levers: Value (V) Cost (C) Economic Value Created: (V-C)

E N D
Industry and Firm Effects Jointly Determine Competitive Advantage EXHIBIT 6.1
Strategic Position • Determined by Firm’s Business-Level Strategy • Two primary competitive levers: • Value (V) • Cost (C) • Economic Value Created: (V-C) • The greater (V-C) = Competitive Advantage • Strategic Position Based on: • Value creation • Cost
Strategic Trade-offs } Than Rivals • Cost or Value Position? • Higher Value = Higher Costs • Value Creation – Costs = Value Gap • A business strategy is more likely to lead to competitive advantage if either: • Perform Similar Activities Differently OR • Perform Different Activities
EXHIBIT 6.2 Strategic Position and Competitive Scope: Generic Business Strategies
Value Drivers • Product Features • Most important & clearest drivers • Unique product features>> higher price • BMW M3 • Customer Service • ID unmet customer needs & satisfy them • Zappos online retailer • Toyota Lexus brand • Customization • Tailoring for specific customers • “Mass customization” • Threadless T-shirts • Complements • Add value when consumed in tandem • DVR (i.e., Tivo)
Value Drivers: Differentiation EXHIBIT 6.3 • Differentiation: • Product features, customer service, customization, and complements • Competitive advantage = economic value created (V-C) > competitors • Marriott line of Hotels
Cost Drivers: Cost-Leadership EXHIBIT 6.4 • Cost Leadership: • Cost of input factors, economies of scale, and learning-curve and experience-curve effects • Competitive advantage = economic value created (V-C) > competitors • Walmart vs. Kmart • Dell vs. Compaq, Gateway, & HP
Cost Drivers: Inputs & Scale • Input Factors • Lower-cost materials, money or labor. • De Beers – diamonds • Alcoa – bauxite • GE Capital • Economies of Scale • Increased output decreased cost per unit • Spread fixed costs • Cube-square rule • Boeing Aircraft • Carrefour retailer
Economies and Diseconomies of Scale • Economies of Scale – output up, cost per unit down • Microsoft upfront R&D for Windows 7 • Very low marginal costs to make copies of the operating system • Specialized Systems • ERP software or robots • Physical Properties • Cube-square rule for "big box" stores • Minimum Efficient Scale (MES) • Lowest cost position constant returns to scale • Diseconomies of Scale • Complexity of management or physical limits • W. L. Gore and aircraft aeronautics
EXHIBIT 6.5 Economies of Scale and Diseconomies of Scale
"Big Box" Retailers' Advantage • Cube-Square Rule: • Each dimension increases 50% (2 goes to 3) BUT • Each volume increases 237.5% (8 goes to 27) !!
Cost Drivers: Learning & Experience Curves • Learning Curves • “Learn by doing” • Steeper curve more learning • Aircraft manufacturing • Cardiac surgeons • Experience Curves • Combine economy of scale & learning curves • Scale comes down a given learning curve • Technology allows movement to steeper curve • Combination can leapfrog in competitive advantage • Walmart high volumes & technology leadership
EXHIBIT 6.6 Gaining Competitive Advantage Through Learning and Experience Curves
EXHIBIT 6.7 Competitive Positioning and the Five Forces
INTEGRATION STRATEGY: COSTLEADERSHIP AND DIFFERENTIATION • Trade-offs between low cost & differentiation • Value & Cost Drivers of Integration • Quality • Can increase perceived value & lower cost (V-C) • Economies of Scope • Starbucks adding hot tea to its menu • Innovation • IKEA - stylist furniture in flat pack delivery • Structure, Culture, & Routines • Ambidextrous organization – explore AND exploit • Intel current and future products and services
Avon Pursuing an Integration Strategy EXHIBIT 6.8
EXHIBIT 6.9 Value and Cost Drivers
Integration Strategy – Corporate Level • Conglomerates can coordinate above the SBU level • Tata Group from India • 2008 bought Jaguar & Land Rover • Prestigious differentiated products • 2009 Tata Motors creates a Nano car • Lowest-priced car in the world! • Zero to 60 mph in 30 seconds • No radio or glove box • Targets bicyclists to move to cars
THE DYNAMICS OF COMPETITIVE POSITIONING • Strategic Positions need to change over time • eBay withdrew from selling new goods & sold Skype • Productivity Frontier • Value-cost relationship • Captures the best practices at a point in time • Mobile Devices • 2005 – Apple differentiator, Dell cost leader • 2010 – Apple still differentiator, HP moving to successful integrator, Dell shifting toward integrator
The Dynamics of Competitive Positioning: Apple, HP, and Dell EXHIBIT 6.10