Download
1 / 8
80 likes | 184 Views
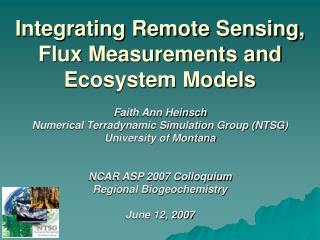
Ensemble Ecosystem Model Experiment and Intercomparison using the Terrestrial Observation and Prediction System (TOPS). Weile Wang, Jennifer L. Dungan, Andrew Michaelis, Hirofumi Hashimoto, Ichii Kazuhito, Ramakrishna Nemani. Ecosystem Models.

E N D
Ensemble Ecosystem Model Experiment and Intercomparison using the Terrestrial Observation and Prediction System (TOPS) Weile Wang, Jennifer L. Dungan, Andrew Michaelis, Hirofumi Hashimoto, Ichii Kazuhito, Ramakrishna Nemani
Ecosystem Models • Models are run for the NACP domain at 8km grids for the period 1982-2006 using the Terrestrial Observation and Prediction System (TOPS) • Standard model outputs include GPP, NPP, NEE, ET, and soil moisture
Model inputs • Climate Data : • Daily maximum/minimum temperature and precipitation extrapolated from the NCDC Cooperative Summary of the Day data (TD3200) for the period 1982-2006; • Dew-point temperatures, vapor pressure deficit, and incident solar radiation generated based on algorithms described in Campbell and Norman (1998) and Jolly et al. (2005); • Satellite Data: • AVHRR/MODIS monthly LAI/FPAR (1982-2006); • MODIS 12Q1 land cover map; • Soil Data: • Soil texture and effective depth from ECOCLIMAP (Masson et al., 2003).
Temperature-Precipitation Space Precipitation Carbon Fluxes in T-P Space Carbon Fluxes (GPP, NPP, and NEE) Temperature
Results: GPP FLEX-BGC
Results: NPP FLEX-BGC
Results: NEE FLEX-BGC
Conclusions • Annual total NPP for North America is estimated to be ~4.4-6.7 PgC/yr and the overall NPP/GPP ratio of both BGC and LPJ is about 0.50 • Patterns of NPP generally follow those of GPP (BGC and LPJ), however, remarkable differences are found in some regions (e.g., LPJ) • Substantial diversity is shown in NEE results: BGC and CASA are essentially carbon neutral; the total NEE estimated by LPJ and Flex-BGC is 0.47 PgC/yr and 1.29 PgC/yr, respectively (positive values indicate carbon sink)