Download
1 / 2
50 likes | 313 Views
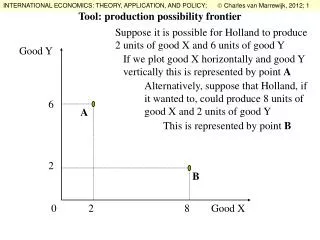
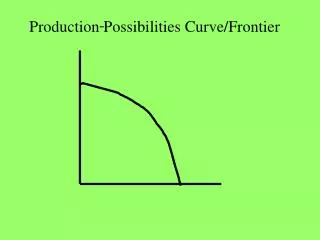
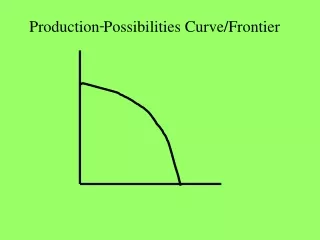
Production Possibility Curve (or Frontier). Features of The PPC. - Shows the different rate of producing 2 goods. B * ( Scarcity). - All combination on as well as under the curve represents possible combination sets of 2 goods.

E N D
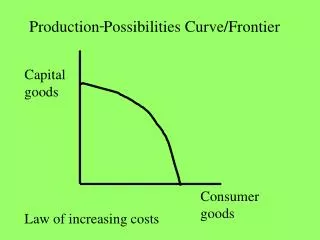
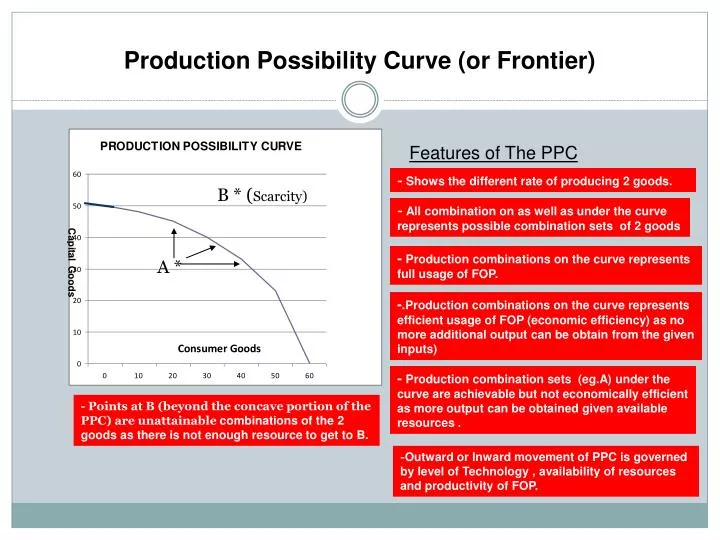
Production Possibility Curve (or Frontier) Features of The PPC - Shows the different rate of producing 2 goods. B * (Scarcity) - All combination on as well as under the curve represents possible combination sets of 2 goods - Production combinations on the curve represents full usage of FOP. A * -.Production combinations on the curve represents efficient usage of FOP (economic efficiency) as no more additional output can be obtain from the given inputs) - Production combination sets (eg.A) under the curve are achievable but not economically efficient as more output can be obtained given available resources . - Points at B (beyond the concave portion of the PPC) are unattainablecombinations of the 2 goods as there is not enough resource to get to B. -Outward or Inward movement of PPC is governed by level of Technology , availability of resources and productivity of FOP.
Production Possibility Curve (or Frontier) and Opportunity Cost Increasing Opportunity Cost -The slope along the PPC informs us of the increase opp. cost of producing consumer goods =1/2 -The opporutnity cost of producing consumer goods at K is less than at M. Q1. How do you interprete this from the curve? =3/2 • At point K to produce 1 consumer good the opp. cost is 0.5 capital goods. • At point M to produce 1 consumer good the opp. Cost is 1.5 captial goods. 20 Q2. Why is there increasing oppportunity cost moving down the PPC. - FOP that were meant to be use to produce captial goods are increasingly transfered to be used to produce consumer goods. This increase inefficiency and causes opp. cost to rise. The PPC