Download
1 / 1
20 likes | 191 Views
GENOMIC MAPPING FOR DROUGHT TOLERANCE IN SORGHUM.

E N D
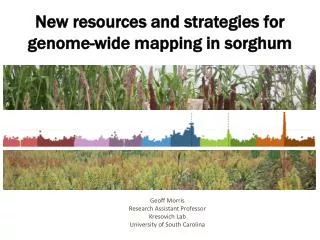
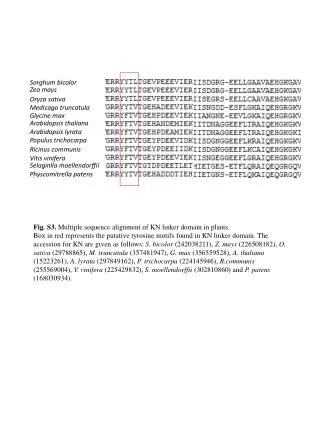
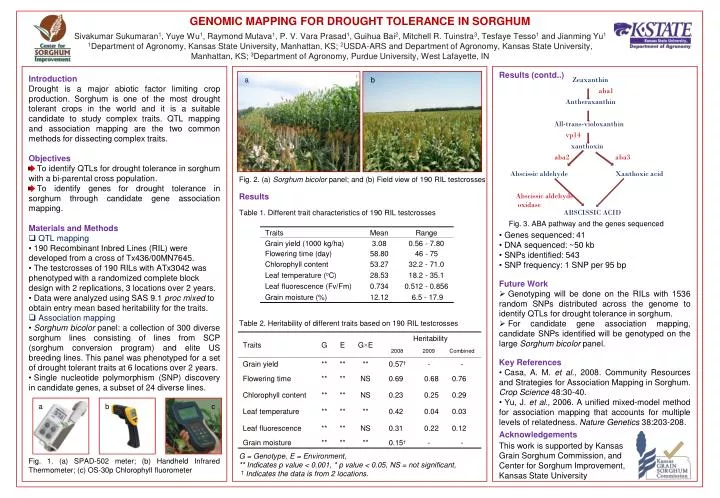
GENOMIC MAPPING FOR DROUGHT TOLERANCE IN SORGHUM Sivakumar Sukumaran1, Yuye Wu1, Raymond Mutava1, P. V. Vara Prasad1, Guihua Bai2, Mitchell R. Tuinstra3, Tesfaye Tesso1 and Jianming Yu11Department of Agronomy, Kansas State University, Manhattan, KS; 2USDA-ARS and Department of Agronomy, Kansas State University, Manhattan, KS; 3Department of Agronomy, Purdue University, West Lafayette, IN • Introduction • Drought is a major abiotic factor limiting crop production. Sorghum is one of the most drought tolerant crops in the world and it is a suitable candidate to study complex traits. QTL mapping and association mapping are the two common methods for dissecting complex traits. • Objectives • To identify QTLs for drought tolerance in sorghum with a bi-parental cross population. • To identify genes for drought tolerance in sorghum through candidate gene association mapping. • Materials and Methods • QTL mapping • 190 Recombinant Inbred Lines (RIL) were developed from a cross of Tx436/00MN7645. • The testcrosses of 190 RILs with ATx3042 was phenotyped with a randomized complete block design with 2 replications, 3 locations over 2 years. • Data were analyzed using SAS 9.1 proc mixed to obtain entry mean based heritability for the traits. • Association mapping • Sorghum bicolor panel: a collection of 300 diverse sorghum lines consisting of lines from SCP (sorghum conversion program) and elite US breeding lines. This panel was phenotyped for a set of drought tolerant traits at 6 locations over 2 years. • Single nucleotide polymorphism (SNP) discovery in candidate genes, a subset of 24 diverse lines. • Fig. 1. (a) SPAD-502 meter; (b) Handheld Infrared Thermometer; (c) OS-30p Chlorophyll fluorometer Results (contd..) a b Zeaxanthin aba1 Antheraxanthin All-trans-violoxanthin vp14 xanthoxin aba2 aba3 Abscissic aldehyde Xanthoxic acid Fig. 2. (a) Sorghum bicolor panel; and (b) Field view of 190 RIL testcrosses Results Abscissic aldehyde oxidase Table 1. Different trait characteristics of 190 RIL testcrosses ABSCISSIC ACID Fig. 3. ABA pathway and the genes sequenced • Genes sequenced: 41 • DNA sequenced: ~50 kb • SNPs identified: 543 • SNP frequency: 1 SNP per 95 bp • Future Work • Genotyping will be done on the RILs with 1536 random SNPs distributed across the genome to identify QTLs for drought tolerance in sorghum. • For candidate gene association mapping, candidate SNPs identified will be genotyped on the large Sorghum bicolor panel. • Key References • Casa, A. M. et al., 2008. Community Resources and Strategies for Association Mapping in Sorghum.Crop Science 48:30-40. • Yu, J. et al., 2006. A unified mixed-model method for association mapping that accounts for multiple levels of relatedness. Nature Genetics 38:203-208. Table 2. Heritability of different traits based on 190 RIL testcrosses a b c c Acknowledgements This work is supported by Kansas Grain Sorghum Commission, and Center for Sorghum Improvement, Kansas State University G = Genotype, E = Environment, ** Indicates p value < 0.001, * p value < 0.05, NS = not significant, †Indicates the data is from 2 locations.