Download
1 / 1
10 likes | 159 Views
MAGIC-II. MAGIC-I. Very-high energy observation of the peculiar transient event Swift J1644+57 with the MAGIC telescopes.

E N D
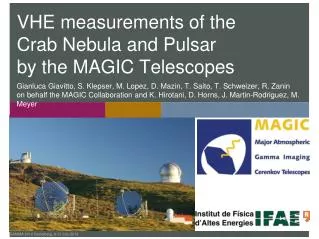
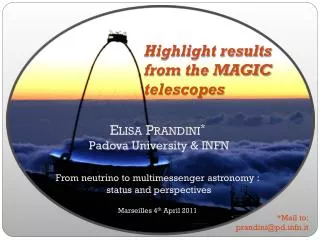
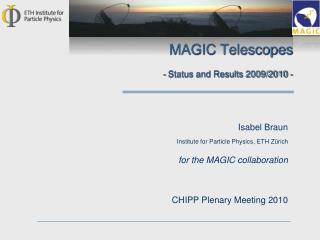
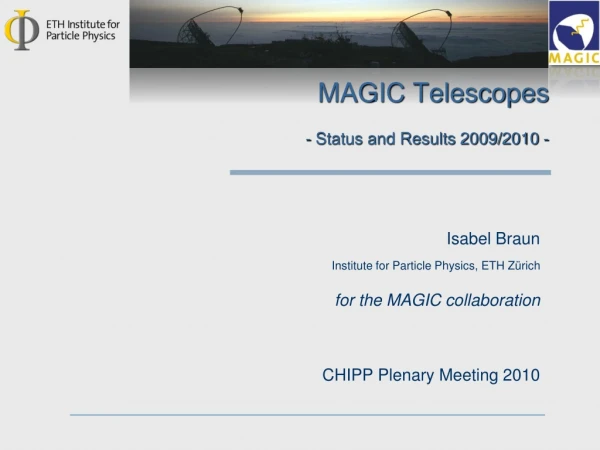
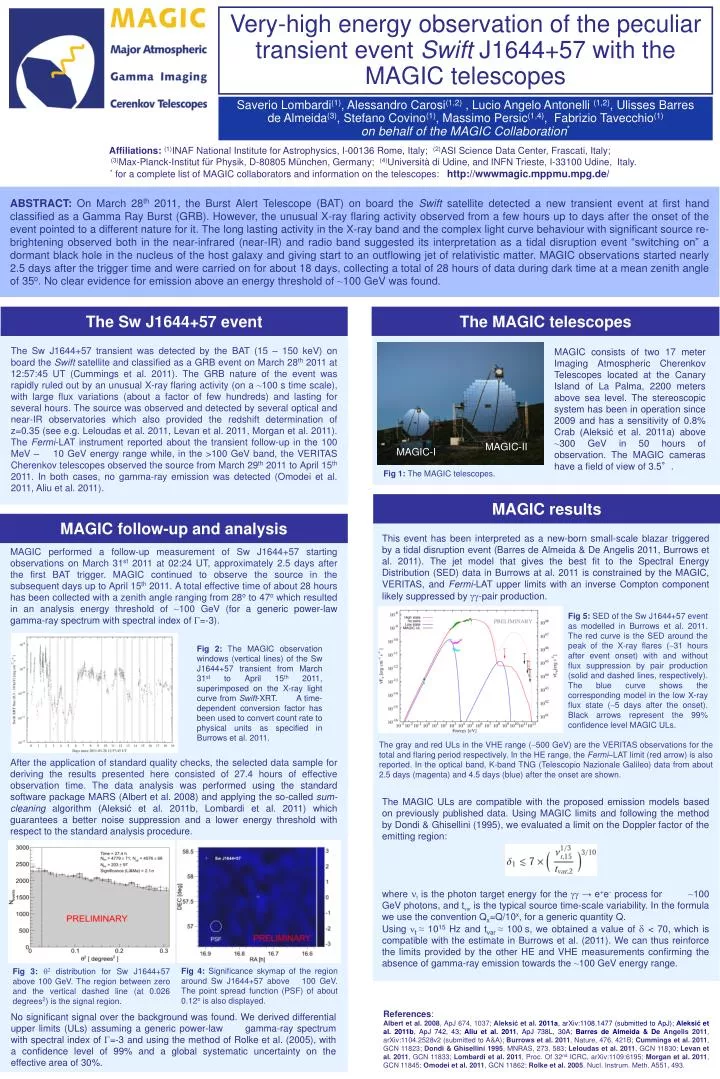
MAGIC-II MAGIC-I Very-high energy observation of the peculiar transient event Swift J1644+57 with the MAGIC telescopes Saverio Lombardi(1), Alessandro Carosi(1,2) , Lucio Angelo Antonelli (1,2), Ulisses Barres de Almeida(3), Stefano Covino(1), Massimo Persic(1,4), Fabrizio Tavecchio(1) on behalf of the MAGIC Collaboration* Affiliations:(1)INAF National Institute for Astrophysics, I-00136 Rome, Italy; (2)ASI Science Data Center, Frascati, Italy; (3)Max-Planck-Institut für Physik, D-80805 München, Germany; (4)Università di Udine, and INFN Trieste, I-33100 Udine, Italy. * for a complete list of MAGIC collaborators and information on the telescopes: http://wwwmagic.mppmu.mpg.de/ ABSTRACT: On March 28th 2011, the Burst Alert Telescope (BAT) on board the Swift satellite detected a new transient event at first hand classified as a Gamma Ray Burst (GRB). However, the unusual X-ray flaring activity observed from a few hours up to days after the onset of the event pointed to a different nature for it. The long lasting activity in the X-ray band and the complex light curve behaviour with significant source re-brightening observed both in the near-infrared (near-IR) and radio band suggested its interpretation as a tidal disruption event “switching on” a dormant black hole in the nucleus of the host galaxy and giving start to an outflowing jet of relativistic matter. MAGIC observations started nearly 2.5 days after the trigger time and were carried on for about 18 days, collecting a total of 28 hours of data during dark time at a mean zenith angle of 35o. No clear evidence for emission above an energy threshold of ~100 GeV was found. The MAGIC telescopes The Sw J1644+57 event MAGIC consists of two 17 meter Imaging Atmospheric Cherenkov Telescopes located at the Canary Island of La Palma, 2200 meters above sea level. The stereoscopic system has been in operation since 2009 and has a sensitivity of 0.8% Crab (Aleksić et al. 2011a) above ~300 GeV in 50 hours of observation. The MAGIC cameras have a field of view of 3.5°. The Sw J1644+57 transient was detected by the BAT (15 – 150 keV) on board the Swift satellite and classified as a GRB event on March 28th 2011 at 12:57:45 UT (Cummings et al. 2011). The GRB nature of the event was rapidly ruled out by an unusual X-ray flaring activity (on a ~100 s time scale), with large flux variations (about a factor of few hundreds) and lasting for several hours. The source was observed and detected by several optical and near-IR observatories which also provided the redshift determination of z=0.35 (see e.g. Leloudas et al. 2011, Levan et al. 2011, Morgan et al. 2011). The Fermi-LAT instrument reported about the transient follow-up in the 100 MeV – 10 GeV energy range while, in the >100 GeV band, the VERITAS Cherenkov telescopes observed the source from March 29th 2011 to April 15th 2011. In both cases, no gamma-ray emission was detected (Omodei et al. 2011, Aliu et al. 2011). Fig 1: The MAGIC telescopes. MAGIC results MAGIC follow-up and analysis This event has been interpreted as a new-born small-scale blazar triggered by a tidal disruption event (Barres de Almeida & De Angelis 2011, Burrows et al. 2011). The jet model that gives the best fit to the Spectral Energy Distribution (SED) data in Burrows at al. 2011 is constrained by the MAGIC, VERITAS, and Fermi-LAT upper limits with an inverse Compton component likely suppressed by gg-pair production. The MAGIC ULs are compatible with the proposed emission models based on previously published data. Using MAGIC limits and following the method by Dondi & Ghisellini (1995), we evaluated a limit on the Doppler factor of the emitting region: where nt is the photon target energy for the gg → e+e- process for ~100 GeV photons, and tvar is the typical source time-scale variability. In the formula we use the convention Qx=Q/10x, for a generic quantity Q. Using nt ≈ 1015 Hz and tvar ≈ 100s, we obtained a value of d < 70, which is compatible with the estimate in Burrows et al. (2011). We can thus reinforce the limits provided by the other HE and VHE measurements confirming the absence of gamma-ray emission towards the ~100 GeV energy range. MAGIC performed a follow-up measurement of Sw J1644+57 starting observations on March 31st 2011 at 02:24 UT, approximately 2.5 days after the first BAT trigger. MAGIC continued to observe the source in the subsequent days up to April 15th 2011. A total effective time of about 28 hours has been collected with a zenith angle ranging from 28o to 47o which resulted in an analysis energy threshold of ~100 GeV (for a generic power-law gamma-ray spectrum with spectral index of G=-3). Fig 5: SED of the Sw J1644+57 event as modelled in Burrows et al. 2011. The red curve is the SED around the peak of the X-ray flares (~31 hours after event onset) with and without flux suppression by pair production (solid and dashed lines, respectively). The blue curve shows the corresponding model in the low X-ray flux state (~5 days after the onset). Black arrows represent the 99% confidence level MAGIC ULs. Fig 2: The MAGIC observation windows (vertical lines) of the Sw J1644+57 transient from March 31st to April 15th 2011, superimposed on the X-ray light curve from Swift-XRT. A time-dependent conversion factor has been used to convert count rate to physical units as specified in Burrows et al. 2011. The gray and red ULs in the VHE range (~500 GeV) are the VERITAS observations for the total and flaring period respectively. In the HE range, the Fermi–LAT limit (red arrow) is also reported. In the optical band, K-band TNG (Telescopio Nazionale Galileo) data from about 2.5 days (magenta) and 4.5 days (blue) after the onset are shown. After the application of standard quality checks, the selected data sample for deriving the results presented here consisted of 27.4 hours of effective observation time. The data analysis was performed using the standard software package MARS (Albert et al. 2008) and applying the so-called sum-cleaning algorithm (Aleksić et al. 2011b, Lombardi et al. 2011) which guarantees a better noise suppression and a lower energy threshold with respect to the standard analysis procedure. Fig 4: Significance skymap of the region around Sw J1644+57 above 100 GeV. The point spread function (PSF) of about 0.12o is also displayed. Fig 3:q2 distribution for Sw J1644+57 above 100 GeV. The region between zero and the vertical dashed line (at 0.026 degrees2) is the signal region. References: Albert et al. 2008, ApJ 674, 1037; Aleksić et al. 2011a, arXiv:1108.1477 (submitted to ApJ); Aleksić et al. 2011b, ApJ 742, 43; Aliu et al. 2011, ApJ 738L, 30A; Barres de Almeida & De Angelis 2011, arXiv:1104.2528v2 (submitted to A&A); Burrows et al. 2011, Nature, 476, 421B; Cummings et al. 2011, GCN 11823; Dondi & Ghisellini 1995, MNRAS, 273, 583; Leloudas et al. 2011, GCN 11830; Levan et al. 2011, GCN 11833; Lombardi et al. 2011, Proc. Of 32nd ICRC, arXiv:1109:6195; Morgan et al. 2011, GCN 11845; Omodei et al. 2011, GCN 11862; Rolke et al. 2005, Nucl. Instrum. Meth. A551, 493. No significant signal over the background was found. We derived differential upper limits (ULs) assuming a generic power-law gamma-ray spectrum with spectral index of G=-3 and using the method of Rolke et al. (2005), with a confidence level of 99% and a global systematic uncertainty on the effective area of 30%.