Download
1 / 50
500 likes | 575 Views
Fig. 16-1. Mixture of heat-killed S cells and living R cells. EXPERIMENT. Living R cells (control). Living S cells (control). Heat-killed S cells (control). Fig. 16-2. RESULTS. Mouse dies. Mouse healthy. Mouse healthy. Mouse dies. Living S cells. Phage head. Fig. 16-3.

E N D
Mixture of heat-killed S cells and living R cells EXPERIMENT Living R cells (control) Living S cells (control) Heat-killed S cells (control) Fig. 16-2 RESULTS Mouse dies Mouse healthy Mouse healthy Mouse dies Living S cells
Phage head Fig. 16-3 Tail sheath Tail fiber DNA 100 nm Bacterial cell
EXPERIMENT Fig. 16-4-1 Radioactive protein Phage Bacterial cell DNA Batch 1: radioactive sulfur (35S) Radioactive DNA Batch 2: radioactive phosphorus (32P)
EXPERIMENT Empty protein shell Fig. 16-4-2 Radioactive protein Phage Bacterial cell DNA Batch 1: radioactive sulfur (35S) Phage DNA Radioactive DNA Batch 2: radioactive phosphorus (32P)
EXPERIMENT Empty protein shell Radioactivity (phage protein) in liquid Fig. 16-4-3 Radioactive protein Phage Bacterial cell DNA Batch 1: radioactive sulfur (35S) Phage DNA Centrifuge Pellet (bacterial cells and contents) Radioactive DNA Batch 2: radioactive phosphorus (32P) Centrifuge Radioactivity (phage DNA) in pellet Pellet
Nitrogenous bases Sugar–phosphate backbone 5 end Fig. 16-5 Thymine (T) Adenine (A) Cytosine (C) DNA nucleotide Phosphate Sugar (deoxyribose) 3 end Guanine (G)
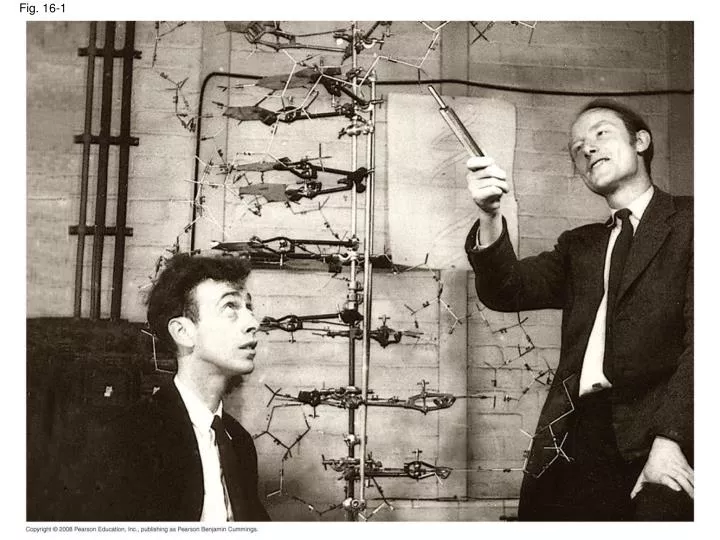
Fig. 16-6 (b) Franklin’s X-ray diffraction photograph of DNA (a) Rosalind Franklin
Fig. 16-6a (a) Rosalind Franklin
Fig. 16-6b (b) Franklin’s X-ray diffraction photograph of DNA
Fig. 16-7 5 end Hydrogen bond 3 end 1 nm 3.4 nm 3 end 0.34 nm 5 end (c) Space-filling model (a) Key features of DNA structure (b) Partial chemical structure
5 end Hydrogen bond 3 end Fig. 16-7a 1 nm 3.4 nm 3 end 0.34 nm 5 end (a) Key features of DNA structure (b) Partial chemical structure
Fig. 16-7b (c) Space-filling model
Fig. 16-UN1 Purine + purine: too wide Pyrimidine + pyrimidine: too narrow Purine + pyrimidine: width consistent with X-ray data
Fig. 16-8 Adenine (A) Thymine (T) Cytosine (C) Guanine (G)
Fig. 16-9-1 A T C G T A A T C G (a) Parent molecule
Fig. 16-9-2 A T T A C G G C A T A T T A T A C C G G (b) Separation of strands (a) Parent molecule
Fig. 16-9-3 A T A T A T A T C G C G C G C G A T A T A A T T T A T A T T A A C C G C G C G G (c) “Daughter” DNA molecules, each consisting of one parental strand and one new strand (b) Separation of strands (a) Parent molecule
First replication Second replication Parent cell Fig. 16-10 (a) Conservative model (b) Semiconserva- tive model (c) Dispersive model
EXPERIMENT Bacteria cultured in medium containing 15N Bacteria transferred to medium containing 14N 1 2 Fig. 16-11 RESULTS DNA sample centrifuged after 20 min (after first application) 4 DNA sample centrifuged after 40 min (after second replication) Less dense 3 More dense CONCLUSION First replication Second replication Conservative model Semiconservative model Dispersive model
EXPERIMENT Fig. 16-11a Bacteria cultured in medium containing 15N Bacteria transferred to medium containing 14N 2 1 RESULTS DNA sample centrifuged after 20 min (after first application) DNA sample centrifuged after 20 min (after second replication) Less dense 3 4 More dense
CONCLUSION First replication Second replication Fig. 16-11b Conservative model Semiconservative model Dispersive model
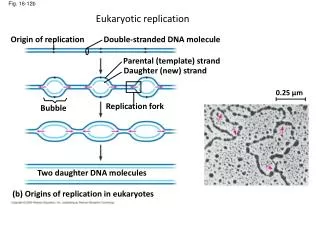
Origin of replication Parental (template) strand Daughter (new) strand Replication fork Fig. 16-12 Double- stranded DNA molecule Replication bubble 0.5 µm Two daughter DNA molecules (a) Origins of replication in E. coli Origin of replication Double-stranded DNA molecule Parental (template) strand Daughter (new) strand 0.25 µm Replication fork Bubble Two daughter DNA molecules (b) Origins of replication in eukaryotes
Origin of replication Parental (template) strand Fig. 16-12a Daughter (new) strand Replication fork Double-stranded DNA molecule Replication bubble 0.5 µm Two daughter DNA molecules (a) Origins of replication in E. coli
Origin of replication Double-stranded DNA molecule Fig. 16-12b Parental (template) strand Daughter (new) strand 0.25 µm Replication fork Bubble Two daughter DNA molecules (b) Origins of replication in eukaryotes
Fig. 16-13 Primase Single-strand binding proteins 3 Topoisomerase 5 3 RNA primer 5 5 3 Helicase
New strand 5 end Template strand 3 end 5 end 3 end Fig. 16-14 Sugar T A A T Base Phosphate C G C G G C G C DNA polymerase 3 end A A T T 3 end Pyrophosphate C C Nucleoside triphosphate 5 end 5 end
Overview Origin of replication Leading strand Lagging strand Fig. 16-15 Primer Lagging strand Leading strand Overall directions of replication Origin of replication 3 5 RNA primer 5 “Sliding clamp” 3 5 DNA poll III Parental DNA 3 5 5 3 5
Fig. 16-15a Overview Origin of replication Leading strand Lagging strand Primer Leading strand Lagging strand Overall directions of replication
Origin of replication 3 Fig. 16-15b 5 RNA primer 5 “Sliding clamp” 3 5 DNA pol III Parental DNA 3 5 5 3 5
Overview Origin of replication Lagging strand Leading strand Lagging strand 2 1 Leading strand Overall directions of replication Fig. 16-16 3 5 3 5 Template strand RNA primer 3 5 3 1 5 3 Okazaki fragment 5 3 1 5 5 3 3 2 5 1 5 3 3 5 1 2 5 3 3 5 1 2 Overall direction of replication
Fig. 16-16a Overview Origin of replication Leading strand Lagging strand Lagging strand 2 1 Leading strand Overall directions of replication
3 5 3 5 Template strand Fig. 16-16b1
3 5 3 5 Template strand Fig. 16-16b2 3 5 3 RNA primer 1 5
3 5 3 5 Template strand Fig. 16-16b3 3 5 3 RNA primer 1 5 3 Okazaki fragment 5 3 1 5
3 5 3 5 Template strand Fig. 16-16b4 3 5 3 RNA primer 1 5 3 Okazaki fragment 5 3 1 5 3 5 3 2 5 1
3 5 3 5 Template strand Fig. 16-16b5 3 5 3 RNA primer 1 5 3 Okazaki fragment 5 3 1 5 3 5 3 2 5 1 5 3 3 5 1 2
3 5 3 5 Template strand Fig. 16-16b6 3 5 3 RNA primer 1 5 3 Okazaki fragment 5 3 1 5 3 5 3 2 5 1 5 3 3 5 1 2 5 3 3 5 1 2 Overall direction of replication
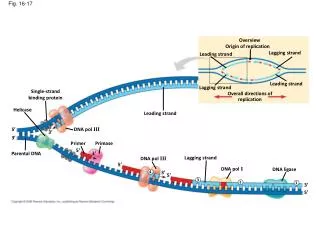
Overview Fig. 16-17 Origin of replication Lagging strand Leading strand Leading strand Lagging strand Single-strand binding protein Overall directions of replication Helicase Leading strand 5 DNA pol III 3 3 Primer Primase 5 3 Parental DNA Lagging strand DNA pol III 5 DNA pol I DNA ligase 4 3 5 3 2 1 3 5
Fig. 16-18 Nuclease DNA polymerase DNA ligase
5 Ends of parental DNA strands Leading strand Lagging strand 3 Fig. 16-19 Last fragment Previous fragment RNA primer Lagging strand 5 3 Parental strand Removal of primers and replacement with DNA where a 3 end is available 5 3 Second round of replication 5 New leading strand 3 5 New lagging strand 3 Further rounds of replication Shorter and shorter daughter molecules
Fig. 16-20 1 µm
Fig. 16-21a Nucleosome (10 nm in diameter) DNA double helix (2 nm in diameter) H1 Histone tail Histones DNA, the double helix Histones Nucleosomes, or “beads on a string” (10-nm fiber)
Chromatid (700 nm) Fig. 16-21b 30-nm fiber Loops Scaffold 300-nm fiber Replicated chromosome (1,400 nm) 30-nm fiber Looped domains (300-nm fiber) Metaphase chromosome
RESULTS Condensin and DNA (yellow) Outline of nucleus Condensin (green) DNA (red at periphery) Fig. 16-22 Mutant cell nucleus Normal cell nucleus
Fig. 16-UN2 G C A T A T Nitrogenous bases G C Sugar-phosphate backbone C G A T C G Hydrogen bond T A
Fig. 16-UN3 DNA pol III synthesizes leading strand continuously 3 5 Parental DNA DNA pol III starts DNA synthesis at 3 end of primer, continues in 5 3 direction 5 3 5 Lagging strand synthesized in short Okazaki fragments, later joined by DNA ligase Primase synthesizes a short RNA primer 3 5