Download
1 / 23
230 likes | 234 Views
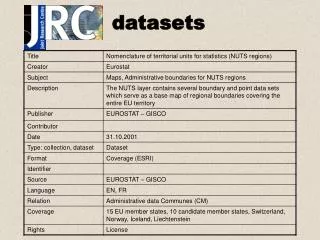
This project aims to produce concrete indicators of landscape state and impact on landscape diversity using EU-wide datasets. The objectives include reducing the set of landscape indicators proposed in previous documents and exploring available datasets for calculating these indicators.

E N D
Landscape Indicators using EU wide datasets Dr Paul Campling Spatial Applications Division Leuven (SADL) WG - AEI EUROSTAT 3 December 2002
Objectives and Aims • Objectives: produce concrete indicators of Landscape State (Indicator 32) and Impact on Landscape Diversity (Indicator 35). • Aim: reduce the set of Landscape Indicators proposed in COM(2000)20 and COM(2001)144. • Explore: EU wide datasets (CLC, FSS and LUCAS) • Time frame: 3 years Landscape Indicators using EU wide datasets
Data Assessment for Landscape Indicators • Review definitions of Landscape State and the Impact on Landscape Diversity • Review model framework for developing landscape indicators and reference levels according to “driving forces” • Develop spatial framework for interpreting landscape indicators on the basis of agro-ecological zoning • Explore available European Union wide datasets for calculating landscape indicators • Select case study areas for the Landscape indicator feasibility study • Develop methods for deriving landscape indicators Landscape Indicators using EU wide datasets
Landscape State • Landscape State represents the complex interaction between human societies and the natural environment • Defined in reference to a former state (desired or planned state). • Analytical indicator of landscape diversity and composition • Candidate indices: • Land use / land cover diversity • Crop importance (specialisation) • Agricultural intensification • Linear elements/features and degree of fragmentation Landscape Indicators using EU wide datasets
Impact on Landscape Diversity • Impact is linked to factors of change • Factors changing agricultural landscape include Policy initiatives (CAP reforms, cross compliance measures, agri-environmental programmes) Farming practices (advances in machinery, new breeds & variaties, organic farming, agro-forestry) Farming economics (parcelsize, land prices, crop/livestock prices, migration) Consumer demands (bio-products, food standards) • Indices of changes in diversity • Evaluation in terms of data on soil, topography and climate (COM (2001) 144) – ‘natural baseline of diversity’ Landscape Indicators using EU wide datasets
EU-wide datasets • GISCO-database • CORINE Land Cover (CLC), Administrative boundaries (NUTS-regions) • FSS at NUTS 2 and 3: • crop type and area, livestock type and number, farm sizes (ha and ESU), fallow, irrigation • LUCAS • land cover & land use, linear features • openness of landscape, vertical and colour indices • Different scales, procedures and definitions -indicators aggregated to NUTS 3 level Landscape Indicators using EU wide datasets
Selection of case study areas (CSAs) • Farming environment is very diverse across EU • EU policy needs to be applied at the local scale in a decentralised way • CSAs reflect different landscape typologies of Europe • Meeus (1988) landscape typology (13 in total, 5 used) • Dominant land use from CLC e.g. arable land, olives and vineyards • Representative of a NUTS 3 area (indices aggregated to NUTS 3 level) • Characteristic of northern and southern Europe Landscape Indicators using EU wide datasets
Selection of case study areas Landscape Indicators using EU wide datasets
Processing of LUCAS SSU-data • 10 SSU’s per PSU: • At each SSU: observation of Land cover and Land use • Calculation of indices – diversity, dominance, characteristics Landscape Indicators using EU wide datasets
Landscape Indicators (LUCAS SSUs) LCDI = # LC classes / PSU LUDI = # LU classes / PSU ADI=#Agric classes / PSU Landscape Indicators using EU wide datasets
Processing of LUCAS transect-data • 1 transect per PSU, 1200 m • Along the transect: observation of land use + linear elements (width > 1m) • Selection of transects per CSA (≥ 1 NUTS3-region) • Calculation of indices – transition, fragmentation, linear elements Landscape Indicators using EU wide datasets
Landscape Indicators (LUCAS transect) LUDI = # LC classes / km LUTI = # LU classes / km ADI=#Agric classes / km FI= # fragments (LUT or LE) / km LEI=# agric. Linear Elements/km Landscape Indicators using EU wide datasets
Number and character of the linear elements (LUCAS Transects) Landscape Indicators using EU wide datasets
Agricultural Importance Index – FSSagricultural area / NUTS surface area Landscape Indicators using EU wide datasets
Arable Importance Index – FSSsum of arable crops / total agricultural area Landscape Indicators using EU wide datasets
Grassland Importance Index temp. + perm grass / total agricultural area Landscape Indicators using EU wide datasets
Irrigation Importance IndexTotal irrigable area / Total agricultural area Landscape Indicators using EU wide datasets
Mean Farm Size (ha)Total agricultural area (ha) / # holdings Landscape Indicators using EU wide datasets
Mean Farm Size (ESU)Total ECU / # holdings Landscape Indicators using EU wide datasets
Agricultural Intensity IndexMean farm size (ESU) / Mean farm size (ha) Landscape Indicators using EU wide datasets
Conclusions (1) • A range of landscape indicators calculated from European Union wide databases such as CLC, FSS and LUCAS • CLC, FSS and LUCAS have different scales, methods and procedures – necessary to attach source of data to each indicator e.g. CLC land cover diversity index, LUCAS land cover diversity index • Case studies selected to represent major landscapes and crop types, results show distinct differentiation in farming environments • Impact on Landscape Diversity requires time series information Landscape Indicators using EU wide datasets
Conclusions (2) LUCAS • Greatest differentiation in terms of land transition index, fragmentation index and linear elements index, reflects differences in parcel sizes and degree of urbanisation FSS 1990 vs 2000 • Agriculture – stable or marginal increase • Arable farming – marginal increase N Europe CSAs, marginal decrease S Europe CSAs • Grassland – marginal increase S Europe CSAs, stable in N Europe CSAs • Irrigation – overall marginal increase Landscape Indicators using EU wide datasets
Landscape Indicators using EU wide datasets Dr Paul Campling Spatial Applications Division Leuven (SADL) WG - AEI EUROSTAT 3 December 2002