Download
1 / 28
320 likes | 824 Views
Service Operations and Waiting Line Models. MD707 Operations Management Professor Joy Field. Issues in Service Operations. Simultaneous production and consumption Inability to inventory the customer-facing portion of services increases the importance of capacity and facilities management

E N D
Service Operations andWaiting Line Models MD707 Operations Management Professor Joy Field
Issues in Service Operations • Simultaneous production and consumption • Inability to inventory the customer-facing portion of services increases the importance of capacity and facilities management • Services tend to be high on experience and credence attributes, and • Much of the service delivery process is transparent to the customer, therefore … • Evaluation of the service is based to a large extent on the process and not just the outcome • Because both the provider and customer are involved in service delivery process (i.e., co-production), effective service delivery requires that service delivery “models” or “scripts” are consistent between the customer and service provider.
Issues in Service Operations(continued) • Customer contact • The interaction between the front-line employee and customer is an important determinant of customer satisfaction, therefore … • A high degree of customer contact requires that the interface between the service provider and customer be carefully managed. • Greater variability (both complexity and divergence) in outcomes exists due to customer participation in service delivery, therefore … • As the customer becomes more actively involved in the service process, it becomes increasingly difficult to deliver the service efficiently. • Even a service that can be characterized as “high customer contact” overall, is usually a mix of high and low contact. • High and low contact segments of the service can be decoupled for greater efficiency, but should not always be decoupled.
Customer Contact Model Potential facility efficiency • Identify those points in the service system where decoupling between high and low contact is possible and desirable. • For “Cost Leader” type services, back-office activities are decoupled from the front office for the purpose of lowering costs. • For “Personal Service” type services, back-office tasks are retained in the front office to pursue non-cost-oriented objectives. • For “Kiosk” type services, all tasks remain in the front-office to save costs. • For “Focused Professional” type services, front- and back-office activities are decoupled to enable front-office workers to provide higher service, rather than to reduce costs. • Employ contact reduction strategies where appropriate. • Employ contact enhancement strategies where appropriate. • Employ traditional efficiency improvement techniques (TQM, BPR, etc.) to improve low contact operations, especially for Cost Leader services. Most services are a combination of high and low contact, and can be designed for both customer satisfaction and efficiency by following these steps:
Customer ContactBehavioral Considerations Sequence effects: • Customers carry away an overall assessment of an experience based on: • The trend in the sequence of pain or pleasure • The high and low points • The ending Duration effects: • People who are engaged in a task don’t notice how long it takes • People will overestimate the time an activity takes • Increasing the number of segments in an encounter lengthens its perceived duration Rationalization effects: • People want things to make sense. If there’s no handy explanation for an unexpected event, they’ll concoct one.
Implications for Service Design • Finish strong. • Get the bad experiences out of the way early. • Segment the pleasure, combine the pain. • Build commitment through choice. • Give people rituals, and stick to them.
Service Organization Control versus autonomy Efficiency versus satisfaction Contact Personnel Customer Perceived control The Service Encounter Triad
Information-Intensive Industries and E-CommerceCharacteristics and Implications for Operations Characteristics: • The cost structure for most information-intensive products is dominated by the “up-front” costs associated with developing a new product and creating its associated production/delivery facilities. • Rapid changes in technology and markets. • Network effects (i.e. the increasing attractiveness to users of certain networks as they increase in size). Network effects are a function of the number of users of a particular technology and the system of complementary products associated with the network. • Quality and time have an interaction effect. • Information technology enables direct, real-time communication with users. • Compatibility is as important as differentiation. Implications: • Increased importance of project management. • Cumulative output and speed to market are key for low-cost strategies. • Installing a less-than-perfect but improvable system is sometimes better than waiting to introduce a more refined system later. • High flexibility (customization) is at least an order qualifier. • Operations must be able to introduce new products and services rapidly. • Operations organized for collaboration and communication.
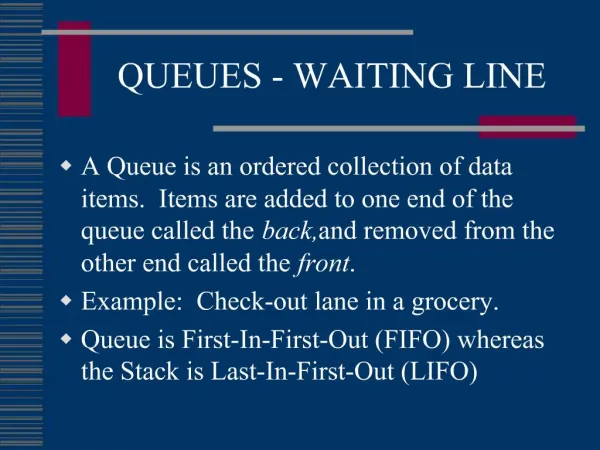
Structure of Waiting Line (Queuing) Problems • Customer population • The source of input to the service system • Whether the input source is finite or infinite • Whether the customers are patient or impatient • The service system • Number of lines - single vs. multiple lines • Arrangement of service facilities - channels and phases • Arrival and service patterns – arrival and service rates are Poisson distributed and interarrival and service times are negative exponentially distributed • Priority rule • First-come, first-served (FCFS) discipline • Other rules - e.g. earliest due date (EDD), shortest processing time (SPT) • Preemptive discipline
Single-Server, Exponential Interarrivaland Service Times (M/M/1) Model Assumptions: • Number of servers = 1 • Number of phases = 1 • Input source: infinite, no balking or reneging • Arrivals: mean arrival rate = ; mean interarrival time = • Service: mean service rate = ; mean service time = • Waiting line: single line; unlimited length • Priority discipline: FCFS
Single-Server Operating Characteristics • Average utilization: • Probability that n customers are in the system: • Probability of less than n customers in the system: • Average number of customers in the system: • Average number of customers in line: • Average time spent in the system: • Average time spent in line:
Single-Server Application Customers arrive to a single service counter at an average rate of 20 customers per hour, according to a Poisson distribution. The service rate is 25 customers per hour, with exponential service times. What is the average utilization of the checkout clerk? What is the average number of customers in line and/or being served? What is the average number of customers in line? What is the average amount of time from when a customer joins the line until he/she is done being served? What is the average wait in line? What service rate is required to have customers average only 10 minutes in the system?
Multiple-Server (M/M/S) Model Assumptions: • Number of servers = M • Number of phases = 1 • Input source: infinite, no balking or reneging • Arrivals: mean arrival rate = ; mean interarrival time = • Service: mean service rate = ; mean service time = • Waiting line: single line; unlimited length • Priority discipline: FCFS
Multiple-Server Operating Characteristics • Average utilization: • Probability that zero customers are in the system: • Probability that n customers are in the system: • Average number of customers in line: • Average time spent in line/system: • Average number of customers in the system: • Average waiting time for an arrival not immediately served: • Prob. that an arrival will have to wait for service:
Multiple-Server Application Customers at a bank wait in a single line to be served by the next open teller. The bank has three tellers. A customer arrives in line every thirty seconds, on average, and a teller can serve an average of 50 customers per hour. What is the probability of at least two customers being served or waiting to be served? What is the average amount of time spent waiting in the line? What is the probability that a customer will have to wait for service?
Capacity Utilization and Capacity Squeeze • A capacity squeeze is the breakdown in the ability of the operating system to serve customers in a timely manner as the capacity utilization approaches 100%. As the variability in arrival and service rates increases, a capacity squeeze occurs at a lower capacity utilization. 100 10 8 6 4 2 0 With: • Then: System line length 0 0 0.2 0.25 0.5 1 0.8 4 0.9 9 0.99 99 0 1.0 Capacity utilization
Finite-Source Model Assumptions: • Number of servers = M • Number of phases = 1 • Input source: finite, equals N customers • Arrivals: mean arrival rate = ; mean interarrival time = • Service: mean service rate = ; mean service time = • Waiting line: single line; no more than N - M • Priority discipline: FCFS
Finite-Source Application A company has 5 copiers located in various offices throughout their building. Each copier is used continuously and has an average time between failures of 50 hours. It takes 4 hours for the single service technician to fix a broken copier. What is the average number of copiers in repair or waiting to be repaired?
Cost Analysis A firm has ten field service technicians who carry parts in their service vehicles for repairs to customer equipment. Due to space limitations in their vehicles, they can make service calls for an average of 10 hours before they need to restock their parts. One attendant staffs the parts warehouse for these technicians, and it takes an average of 0.75 hours to restock parts for each technician (exponentially distributed). If a technician’s time is worth $30 per hour, and the cost of a warehouse attendant is $12 per hour, would it reduce overall restocking labor costs to add a second attendant (who also takes an average of 0.75 hours to restock parts for each technician)? Each attendant individually restocks parts for the next technician in line at the warehouse.
Using Waiting Line Modelsto Analyze Service Operations • Balance costs against benefits of improving service system. Also, consider the costs of not making improvements. • Line length - Long lines indicate poor customer service, inefficient service, or inadequate capacity. • Number of customers in system - A large number causes congestion and dissatisfaction. • Waiting time in line - Long waits are associated with poor service. • Total time in system - May indicate problems with customers, server efficiency, or capacity. • Service facility utilization - Control costs without unacceptable reduction in service.
Using Waiting Line Models to Design Service Operations • Arrival rates - Adjust through advertising, promotions, pricing, appointments. • Number of service facilities - Adjust service system capacity. • Number of phases - Consider splitting service tasks. • Number of servers per facility - Work force size. • Server efficiency - Training, incentives, work methods, capital investment. • Priority rule - Decide whether to allow preemption.