Download
1 / 44
450 likes | 693 Views
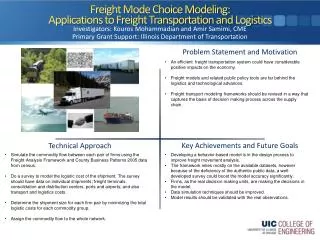
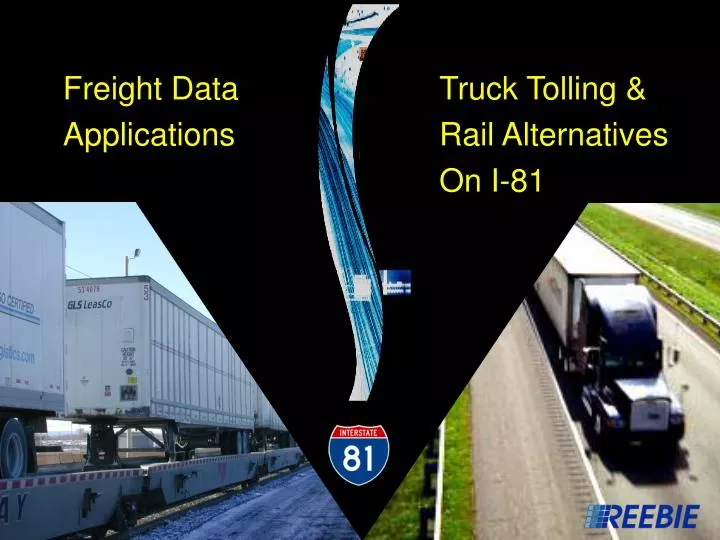
Freight Data Applications. Truck Tolling & Rail Alternatives On I-81. REEBIE ASSOCIATES. U.S. CONSULTANCY FOUNDED IN 1968 FREIGHT TRANSPORTATION SPECIALISTS: MARKETING, OPERATIONS RESEARCH, INTELLIGENCE & SYSTEMS ADVISORY, ANALYTIC AND DATA SERVICES MAIN PRODUCER OF COMMERCIAL FREIGHT

E N D
Freight Data Applications Truck Tolling & Rail Alternatives On I-81
REEBIE ASSOCIATES U.S. CONSULTANCY FOUNDED IN 1968 FREIGHT TRANSPORTATION SPECIALISTS: MARKETING, OPERATIONS RESEARCH, INTELLIGENCE & SYSTEMS ADVISORY, ANALYTIC AND DATA SERVICES MAIN PRODUCER OF COMMERCIAL FREIGHT TRAFFIC DATA IN U.S.
REEBIE ASSOCIATES FREIGHT DEMAND MODAL COST DIVERSION MARKET SEGMENTATION POLICY IMPACTS COMPETITIVE ANALYSIS DATA ASSEMBLY & ECONOMIC DEVELOPMENT INTERPRETATION APPLICATIONS HIGHWAY TRUCK TOLL ANALYSIS CONSULTING SERVICES: TRANSEARCH: FREIGHT FLOW DATABASE NETWORK MODELS: DIVERSION IMPACTS COSTLINE: MULTI-MODAL COST MODELS FREIGHT LOCATER: DATABASE OF SHIPPERS ANALYTIC TOOLS: CARRIERS LOGISTICS COMPANIES SHIPPERS SUPPLIERS PUBLIC AGENCIES FINANCIAL FIRMS CLIENTELE:
TOLL IMPACT ANALYSIS Results and Issues for Virginia
HIGHWAY FUNDING PREDICAMENT • Problem: • Volumes and congestion increasing • Insufficient funds to maintain or expand road network • Federal and state general funds depleted • No political support for general tax increases • DOT’s exploring alternatives: • Shifting funding sources and risks • Funding alternative capacity • Public-private partnerships • Increased “user charge” financing
TOLL INITIATIVES PROPOSED • January 2003 – 19 proposals to add 600 miles of new toll roads • Primary Toll Initiatives • New tolls on existing free highways • HOV to HOT lane conversions • FAIR lane conversions • New toll lane constructions Source: FHWA
I-81 CAPACITY EXPANSION • Virginia’s 1995 Public Private Transportation Act (PPTA) • Proposed partnerships with private industry to: "acquire, construct, improve, maintain, and/or operate qualifying transportation facilities." • I-81 capacity expansion • Two Design-Build proposals submitted • Star Solutions • Fluor Virginia, Inc. • Both proposals included vehicle tolling
DIVERSION ANALYSIS • Projects diversion impact of tolls on freight movements • Utilizes TRANSEARCH Origin-Destination data • Analyzed multiple route alternatives for each lane • Determined next-best alternative routings for each movement • Calibration through motor carrier interviews • Preferred routes; undesirable routes • Evaluation criteria; cost metrics
O-D BASED TOLL ANALYSIS • Houston to New York – next best alternative
MOTOR CARRIER INTERVIEWS • Safety first • Strong preference for National Network Highways • Driver familiarity • Road geometry • Access to fuel and rest facilities • Economics • Tolls raise operating costs • Economics vary by type, size and structure of carrier • Evaluation on case-by-case basis • Consider quality of alternatives • Time penalty vs. toll cost penalty • Few arbitrary decisions to avoid tolls
REEBIE MODEL • Comparative cost based analysis • I-81 and alternative mileage • I-81 and alternative time • Quality of alternative routes • Projected toll • Expected congestion on I-81 and alternatives • Equipment type • Driver type and toll reimbursement policies • Size of carrier
6 CRITICAL QUESTIONS ANSWERED • How much traffic diverts at each toll level? • What kind of traffic diverts at each toll level? • Where does the diverted traffic go? • Who pays the tolls? • What is the impact of tolls on Virginia businesses? • What policy issues do I-81 tolls raise?
FINAL ANALYSIS RESULTS • Projected I-81 truck diversions based on various levels of toll • Very short-haul and very long-haul traffic diverts most quickly • Significant volume of traffic is economically captive to I-81
COMPARATIVE RESULTS • Various methodologies and results • Reebie results are marginally less aggressive Percent of traffic diverted
DIVERSIONS BY O-D MILEAGE • Are we diverting local or long-haul freight?
DIVERTED LOADS BY COMMODITY • What products are diverting? • What products are diverting to VA secondary roads?
IMPACT TO EXISTING ROUTES • Where does the diverted traffic go? Projected diversions at $.20 CPM
TOLL REVENUE MAXIMIZATION • At what point do incremental diversions exceed incremental toll revenue?
POTENTIAL ECONOMIC IMPACT • What industries are most at risk to tolls? Projected job losses at $.20 CPM
VIRGINIA POLICY IMPLICATIONS • Moderate toll levels • Manage risk to Virginia industries • Manage risk to Virginia secondary roads • Manage risk to I-81 Revenue • Toll exclusions and mitigation: • For Virginia bulk industries = reduces industry risk • For empty truck movements = not productive • For local freight = mitigates secondary road impacts • For specific commodity classes = not necessary
NATIONAL POLICY IMPLICATIONS • Attractive revenue and manageable repercussions, before diminishing returns • But: • Do the analysis (I-81 isn’t Everyroad) • Seteris paribus • Not a free good • Tolls are part of the answer, if • Used as investment, not as tax • Part of Logistics Network strategy • Consistent with alternative capacity
STUDY MOTIVATION • 2 Acts of VA Legislature Sought Rail-Based Solutions for: • Projected Congestion • Safety Concerns & Perceptions
Primary Market Research Intermodal Product Design Traffic Diversion Analysis Rail Improvements Assessment 4 STEPS OF ANALYSIS
MARKET SURVEY • Interviewed Shippers, 3PLs, Truck Lines • Primary Purchase Criteria: Reliability, Price, Transit Time • Rate reductions & on-time performance shift traffic • Truck Line decisions also reflect asset utilization • 28% of I-81 truck traffic from large or super motor carriers
I-81 TRUCK TRAFFIC MIX By LOH VA Section
MARKET SEGMENTATION Expanding the Product Portfolio: Intermodal Product Offerings Long-haul dry-van – intermodal compatible – large and super carrier – dense lane traffic Double Stack & TOFC + Expressway + Rolling Highway Intermodally Incompatible Equipment Double Stack & TOFC + Expressway Double Stack & TOFC Traffic handled by Small and Mid-sized motor carriers Traffic moving less than 100 miles in Corridor and/or lacking Intermodal density
PRODUCT STRATEGY • Menu of Services • Full Over-the-Road Equivalent, Not Inferior Good • Trailer Service - TOFC, Expressway-style • Appeal to Motor Carriers • Mimic Highway Network Balance • Target Large Network Carriers as Diversion Mechanism
POTENTIAL RAIL IMPROVEMENTS • Full double track • Reduced curvature • Bi-directional TC signaling • Frequent crossovers • 36-mile new construction • IMX terminals • Improvements serve product strategy
MODERATING CAPITAL INTENSITY Public Investment Options: • Track upgrades, terminal construction, + maintenance = 24% • Add terminal function = 42% • Add platform acquisition + maintenance = 56% • Large portions are capital costs
TRAFFIC DIVERSION (Schematic) Rail traffic builds with time, speed, & investment
KEY IMX PRODUCT PROPOSITION • Open Technology • Competitive Service • Compelling Economic Advantage Aided by: • Confluent volume • Network effects
3-5 YEAR RESULTS Medium Term Capital Investment - Total For NS Corridors Medium Term Diversions - Total For NS Corridors
Long Term Capital Investment - Total For NS Corridors Long Term Diversions - Total For NS Corridors 15-20 YEAR RESULTS
STATE VS. CORRIDOR-WIDE ACTION Medium Term $492M Long Term $492M Medium Term $2.6B Long Term $7.3B Multi-State Corridor Virginia Only
POLICY IMPLICATIONS • Public investment in rail IMX service can produce material relief of highways in practical time frames • Effort required to organize finance & multi-jurisdictional cooperation should pay off
TRANSEARCH FREIGHT DATA: National, State, Nafta, Forecast
TRANSEARCH ELEMENTS TIME PERIOD: Annualized Freight Traffic (2003) Multi-Year Forecasts UNIT OF FREIGHT: Short Tons (2,000 lbs.) Vehicles Value Ton Miles; Vehicle Miles Traveled GEOGRAPHY: 3,100 Counties 900 3-Digit ZIPs 172 Business Economic Areas (BEAs) 50 States COMMODITY: 4-Digit STCC or SIC Detail Standard Equipment Type (Van, Flatbed, Etc.) MODES: For-Hire Motor Carrier: Truckload For-Hire Motor Carrier: LTL Private Motor Carrier Rail Carload Rail TOFC/COFC Intermodal Air Water NETWORKS: ORNL Highway FRA Rail
DATABASE COVERAGE PROVISION OF DATA ELEMENTS On Custom Basis In Product All Truck shipments of Manufactured Goods: • Primary & Secondary • TL, LTL, Private All Truck Shipments of Agricultural Products, Coal, Ores, & Minerals Empty Trucks All Rail, Water, Air Shipments • Plus Air & Intermodal Truck Dray All US/Canada; US/Mexico overland Inland Movement of Overseas Shipments (embedded) Truck shipments of: • Fish, Forest, Waste • Local Services • Mail, Express, Government Domestic Water Drayage Inland Movement of Overseas Shipments segregated Sub-County Detail Global Insight Forecasts New Features
BENEFITS Of FREIGHT DATA: Public Basis for Multimodal Planning, Economic Development, Transport Investment, Consensus Building, Policy Formation: • Distribution & Supply Networks for Key Local Industries • Comparison with Competing Regions - and Interdependence • Quantified Support for Funding Applications • Project Prioritization & Policy Impacts • Growth and Change • Modeling in Data-Rich Environment • Common Framework for Measurement and Communication: State, MPO, Private Sector
AR GA ME NJ OR WA CA IA MI NV TN WI CO IN MN NY TX CT KY MO OH VA FL LA MS OK VT COMMON FRAMEWORK • TRANSEARCH has been applied for Statewide planning, intermodal management, and economic development by 27 states: • These states capture 73% of U.S. Gross Domestic Product • Other Public Sector users include FHWA, AASHTO, Corridor Groups, Major Cities like ATL, CHI, NYC, KC, PHX & STL • Database in continual use by freight carrier clientele
Reebie Associates Transportation Management Consultants 2777 Summer Street, Suite 401 Stamford, CT 06905-4310 U.S.A. Telephone: 203-705-0455 Fax: 203-705-0456 www.reebie.com