Download
1 / 33
340 likes | 365 Views
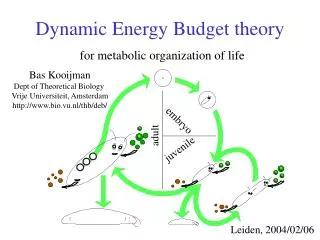
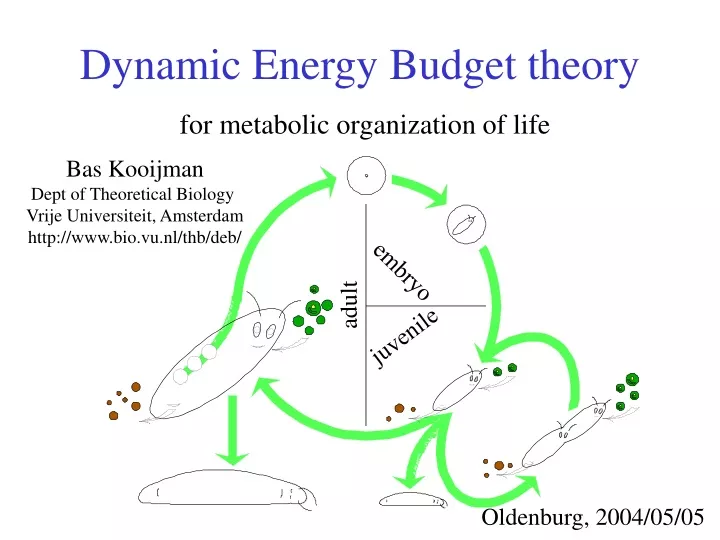
Dynamic Energy Budget theory. for metabolic organization of life. Bas Kooijman Dept of Theoretical Biology Vrije Universiteit, Amsterdam http://www.bio.vu.nl/thb/deb/. embryo. adult. juvenile. Oldenburg, 2004/05/05. Dynamic Energy Budget theory.

E N D
Dynamic Energy Budget theory for metabolic organization of life Bas Kooijman Dept of Theoretical Biology Vrije Universiteit, Amsterdam http://www.bio.vu.nl/thb/deb/ embryo adult juvenile Oldenburg, 2004/05/05
Dynamic Energy Budget theory • First principles, quantitative, axiomatic set up • Aim: Biological equivalent of Theoretical Physics • Primary target: the individual with consequences for • sub-organismal organization • supra-organismal organization • Relationships between levels of organisation • Many popular empirical models are special cases of DEB • Applications in • ecotoxicology • biotechnology • Direct links with empiry
system earth space ecosystem population individual cell time molecule Space-time scales Each process has its characteristic domain of space-time scales When changing the space-time scale, new processes will become important other will become less important Individuals are special because of straightforward energy/mass balances
Some DEB pillars • life cycle perspective of individual as primary target • embryo, juvenile, adult (levels in metabolic organization) • life as coupled chemical transformations (reserve & structure) • time, energy & mass balances • surface area/ volume relationships (spatial structure & transport) • homeostasis (stoichiometric constraints via Synthesizing Units) • syntrophy (basis for symbioses, evolutionary perspective) • intensive/extensive parameters: body size scaling
Surface area/volume interactions • nutrient supply to ecosystems (erosion) surface area • production (nutrient concentration) volume • food availability for cows: grass weight/ surface area • food availability for daphnids: algal weight/ volume • feeding rate surface area; maintenance rate volume • isomorphs: surface area volume2/3 • V0-morphs: surface area volume0 • V1-morphs: surface area volume1 • many active enzyme linked to membranes (surfaces) • substrate and product concentrations linked to volumes
Biomass: reserve(s) + structure(s) substrate(s) reserve structure • Reserve(s), structure(s): generalized compounds, • mixtures of proteins, lipids, carbohydrates: fixed composition • Compounds in • reserve(s): equal turnover times, no maintenance costs • structure(s): unequal turnover times, maintenance costs • Reasons to delineate reserve, distinct from structure • metabolic memory • biomass composition depends on growth rate • fluxes are linear sums of assimilation, dissipation and growth • basis of method of indirect calorimetry • explanation of • inter-species body size scaling relationships • respiration patterns (freshly laid eggs don’t respire) • fate of metabolites (e.g. conversion into energy vs buiding blocks)
Biomass composition Data Esener et al 1982, 1983; Kleibsiella on glycerol at 35°C nHE 1.66 nOE 0.422 nNE 0.312 nHV 1.64 nOV 0.379 nNV 0.189 nHW Relative abundance nOW O2 nNW Weight yield, mol.mol-1 Spec prod, mol.mol-1.h-1 Spec growth rate, h-1 CO2 Spec growth rate kE 2.11 h-1 kM 0.021 h-1 yVE 0.904 yXE 1.35 rm 1.05 h-1 g = 1 Spec growth rate, h-1
General assumptions • State variables: structural body mass & reserves • they do not change in composition • Food is converted into faeces • Assimilates derived from food are added to reserves, • which fuel all other metabolic processes • Three categories of processes: • Assimilation: synthesis of (embryonic) reserves • Dissipation: no synthesis of biomass • Growth: synthesis of structural body mass • Product formation: included in these processes (overheads) • Basic life stage patterns • dividers (correspond with juvenile stage) • reproducers • embryo (no feeding • initial structural body mass is negligibly small • initial amount of reserves is substantial) • juvenile (feeding, but no reproduction) • adult (feeding & male/female reproduction)
Specific assumptions • Reserve density hatchling = mother at egg formation • foetuses: embryos unrestricted by energy reserves • Stage transitions: cumulated investment in maturation > threshold • embryo juvenile initiates feeding • juvenile adult initiates reproduction & ceases maturation • Somatic & maturity maintenance structure volume • (but some maintenance costs surface area) • maturity maintenance does not increase • after a given cumulated investment in maturation • Feeding rate surface area; fixed food handling time • Partitioning of reserves should not affect dynamics • comp. body mass does not change at steady state (weak homeostasis) • Fixed fraction of catabolic energy is spent on • somatic maintenance + growth (-rule) • Starving individuals: priority to somatic maintenance • do not change reserve dynamics; continue maturation, reproduction. • or change reserve dynamics; cease maturation, reprod.; do or do not shrink in structure
-rule for allocation Ingestion Respiration Ingestion rate, 105 cells/h O2 consumption, g/h Length, mm Length, mm Length, mm Reproduction Cum # of young • 80% of adult budget • to reproduction in daphnids • puberty at 2.5 mm • No change in • ingest., resp., or growth • Where do resources for • reprod come from? Or: • What is fate of resources • in juveniles? Growth: Von Bertalanffy Age, d Age, d
Embryonic development Crocodylus johnstoni, Data from Whitehead 1987 embryo yolk O2 consumption, ml/h weight, g time, d time, d : scaled time l : scaled length e: scaled reserve density g: energy investment ratio ;
Synthesizing units • Generalized enzymes that follow classic enzyme kinetics • E + S ES EP E + P • with two modifications: • back flux is negligibly small • E + S ES EP E + P • specification of transformation is on the basis of • arrival fluxes of substrates rather than concentrations • Concentration: problematic • (intracellular) environments: spatially heterogeneous • state variables in dynamic systems • In spatially homogeneous environments: • arrival fluxes concentrations
Mitochondria TriCarboxylic Acid cycle Enzymes pass metabolites directly to other enzymes enzymes catalizing transformations 5 & 7: bound to inner membrane (and FAD/FADH2) Net transformation: Acetyl-CoA + 3 NAD+ + FAD + GDP 3- + Pi2- + 2 H2O = 2 CO2 + 3 NADH + FADH2 + GTP 4- + 2 H+ + HS-CoA Dual function of intermediary metabolites building blocks energy substrate all eukaryotes once possessed mitochondria, most still do Transformations: 1 Oxaloacetate + Acetyl CoA + H2O = Citrate + HSCoA 2 Citrate = cis-Aconitrate + H2O 3 cis-Aconitrate + H2O = Isocitrate 4 Isocitrate + NAD+ = α-Ketoglutarate + CO2+ NADH + H+ 5 α-Ketoglutarate + NAD+ + HSCoA = Succinyl CoA + CO2 + NADH + H+ 6 Succinyl CoA + GDP 3- + Pi 2- + H+ = Succinate + GTP 4- + HSCoA 7 Succinate + FAD = Fumarate + FADH2 8 Fumarate + H2O = Malate 9 Malate + NAD+ = Oxaloacetate + NADH + H+
Pathways & allocation structure structure maintenance maintenance reserve reserve structure Mixture of products & intermediary metabolites that is allocated to maintenance (or growth) has constant composition reserve maintenance Kooijman & Segel, 2004
Numerical matching for n=4 0 4 1 3 2 2 3 Unbounded fraction 4 Product flux 1 Spec growth rate • = 0.73, 0.67, 0.001, 0.27 handshaking • = 0.67, 0.91, 0.96, 0.97 binding prob k = 0.12, 0.19, 0.54, 0.19 dissociation nSE = 0.032,0.032,0.032,0.032 # in reserve nSV = 0.045,0.045,0.045,0.045 # in structure yEV= 1.2 res/struct kE= 0.4 res turnover jEM = 0.02 maint flux n0E = 0.05 sub in res 0 Rejected flux 1 2 3 Spec growth rate
Matching pathway whole cell No exact match possible between production of products and intermediary metabolites by pathway and requirements by the cell But very close approximation is possible by tuning abundance parameters and/or binding and handshaking parameters Best approximation requires all four tuning parameters per node growth-dependent reserve abundance plays a key role in tuning Kooijman, S. A. L. M. and Segel, L. A. (2004) How growth affects the fate of cellular substrates. Bull. Math. Biol. (to appear)
Product Formation According to Dynamic Energy Budget theory: Product formation rate = wA. Assimilation rate + wM. Maintenance rate + wG . Growth rate For pyruvate: wG<0 ethanol pyruvate, mg/l pyruvate glycerol, ethanol, g/l glycerol Applies to all products, heat & non-limiting substrates Indirect calorimetry (Lavoisier, 1780): heat = wO JO + wC JC + wN JN No reserve: 2-dim basis for product formation throughput rate, h-1 Glucose-limited growth of Saccharomyces Data from Schatzmann, 1975
Symbiosis substrate product Product formation is basic to symbioses
Symbiosis substrate substrate Product formation is basic to symbioses
Steps in symbiogenesis Internalization Free-living, clustering Free-living, homogeneous Reserves merge Structures merge
Symbiogenesis • symbioses: fundamental organization of life based on syntrophy • ranges from weak to strong interactions; basis of biodiversity • symbiogenesis: evolution of eukaryotes (mitochondria, plastids) • DEB model is closed under symbiogenesis: • it is possible to model symbiogenesis of two initially independently • living populations that follow the DEB rules by incremental changes • of parameter values such that a single population emerges that • again follows the DEB rules • essential property for models that apply to all organisms • Kooijman, Auger, Poggiale, Kooi 2003 • Quantitative steps in symbiogenesis and the evolution of homeostasis • Biological Reviews78: 435 - 463
Central Metabolism source polymers monomers waste/source
Modules of central metabolism • Pentose Phosphate (PP) cycle • glucose-6-P ribulose-6-P, • NADP NADPH • Glycolysis • glucose-6-P pyruvate • ADP + P ATP • TriCarboxcyl Acid (TCA) cycle • pyruvate CO2 • NADP NADPH • Respiratory chain • NADPH + O2 NADP + H2O • ADP + P ATP
Evolution of central metabolism in prokaryotes (= bacteria) 3.8 Ga 2.7 Ga i = inverse ACS = acetyl-CoA Synthase pathway PP = Pentose Phosphate cycle TCA = TriCarboxylic Acid cycle Kooijman, Hengeveld 2003 The symbiontic nature of metabolic evolution Acta Biotheoretica (to appear) RC = Respiratory Chain Gly = Glycolysis
Prokaryotic metabolic evolution • Heterotrophy: • pentose phosph cycle • glycolysis • respiration chain • Phototrophy: • el. transport chain • PS I & PS II • Calvin cycle • Chemolithotrophy • acetyl-CoA pathway • inverse TCA cycle • inverse glycolysis
Symbiogenesis 1.5-2 Ga 1.2 Ga
Composed by Bas Kooijman (brown algae) Phaeophyceae Granuloreticulata forams Xenophyophora Basidiomycota Xanthophyceae Raphidophyceae Retaria Ascomycota fungi Chrysophyceae Synurophyceae Glomeromycota Actinopoda Eustigmatophyceae Zygomycota Labyrinthulomycota Dictyochophyceae Microsporidia Bicosoecia Pedinellophyceae Opisthokonts Chytridiomycota Pelagophyceae Bigyromonada Plasmodiophoromycota Bacillariophyceae (diatoms) Cercozoa Chlorarachnida Pseudofungi Chromista Cercomonada animals Bolidophyceae Opalinata animals Choanozoa Prymnesiophyceae loss phagoc. Metamonada Cryptophyceae Apusozoa gap junctions tissues (nervous) mitochondria Sporozoa Alveo- lates (plants) Cormophyta bicentriolar mainly chitin EF1 insertion Percolozoa primary Myxomycota Excavates Dinozoa chloroplast Protostelida secondary (green algae) Chlorophyceae Ciliophora Bikont DHFR-TS gene fusion Amoebozoa Euglenozoa chloroplast Archamoeba Plantae tertiary mainly celllose membr. dyn unikont cortical alveoli (red algae) Rhodophyceae chloroplast Rhizopoda chloroplasts triple roots Loukozoa photo Bacteria Bacteria symbionts Glaucophyceae Sizes of blobs do not reflect number of species Survey of organisms
Inter-species body size scaling • parameter values tend to co-vary across species • parameters are either intensive or extensive • ratios of extensive parameters are intensive • maximum body length is • allocation fraction to growth + maint. (intensive) • volume-specific maintenance power (intensive) • surface area-specific assimilation power (extensive) • conclusion : (so are all extensive parameters) • write physiological property as function of parameters • (including maximum body weight) • evaluate this property as function of max body weight Kooijman 1986 Energy budgets can explain body size scaling relations J. Theor. Biol.121: 269-282
Scaling of metabolic rate Respiration: contributions from growth and maintenance Weight: contributions from structure and reserve Structure ; = length; endotherms
Scaling of metabolic rate slope = 1 O2 consumption, l/h Log metabolic rate, w 2 curves fitted: endotherms 0.0226 L2 + 0.0185 L3 0.0516 L2.44 slope = 2/3 ectotherms unicellulars Length, cm Log weight, g Intra-species Inter-species (Daphnia pulex)
Von Bertalanffy growth Length, mm Data from Greve, 1972 Arrhenius Age, d