Download
1 / 21
210 likes | 352 Views
SCIAMACHY long-term validation. M. Weber , S. Mieruch, A. Rozanov, C. von Savigny, W. Chehade, R. Bauer, and H. Bovensmann Institut für Umweltphysik, Universität Bremen. ENVIVAL-LIFE Annual Meeting, Bremen, 6-7 Dec 2010. Topics. Validation of scientific SCIA retrievals : Total ozone

E N D
SCIAMACHY long-term validation • M. Weber, S. Mieruch, A. Rozanov, C. von Savigny, • W. Chehade, R. Bauer, and H. Bovensmann • Institut für Umweltphysik, Universität Bremen ENVIVAL-LIFE Annual Meeting, Bremen, 6-7 Dec 2010
Topics Validation ofscientific SCIA retrievals: • Total ozone • ozonelimbprofiles • NO2 limbprofiles
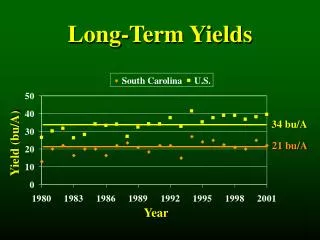
Total ozone • Merged WFDOAS total ozone (´GSG´) data set (1995-2010): www.iup.uni-bremen.de/gome/wfdoas • Used in WMO assessment 2010 • GOME SCIAMACHY • GOME2 • QBO Weber and Steinbrecht, 2010 • record • ozone • hole • splitozone • hole 1990s cold Arctic winters
SCIAMACHY TO3 validation GSG merged data set WMO requirements for trend detection: <1%/decade • GOME1 (1995-present) • Loss of global coverage after June 2003 • Very good agreement with ground data until now (mean bias < 1%) • SCIAMACHY (2002-present) • Good agreement with GOME at start of record • Instrumental trend of -4% per decade • GOME2 (2007-present) • Bias of -1% w.r.t. GOME1 • Dobsons • Brewers • GOME minus Brewers • daily mean <60° lat. SCIAMACHY • GOME (3 month avg.)
Merged WFDOAS total ozone data set (1995-2009) • deseasonalised • Merged WFDOAS datarecordwith GOME1 asreferencedataset: • GOME1 (July 1995- May 2003) • SCIAMACHY biasandtrendcorrected (June 2003 – March 2007) • GOME2 biascorrected (April 2007 – present) Weber and Steinbrecht, 2010
Other GOME/SCIA/GOME2 merged data records • Similarapproachfor ESA/EUMETSAT operational dataproducts (Loyola et al. 2009) • GSG dataare also partofthe NIWA assimilateddatarecord (Bodeker et al., 2005) • Data assimilationapproachcombining all availablesatellitesand different algorithmscovering 30 years (van der A et al., ACP, 2010) Loyola et al., 2009
Conclusion total ozone • GoodagreementwithgroundbasedBrewersandDobsons • But: significant -4%/decadetrendwrt GOME1 andgrounddata • Not a retrievalissue (all algorithmsareaffected) • Most likely level-1 issue • m-factorcorrections (level 1 V5) onlypartiallyhelps • Trend correctionwrtto GOME1 merged GOME1/SCIA/GOME2 dataset • Zonal meansare in goodagreementwith SBUV/TOMS/OMI mergedandgrounddata • Used in WMO 2010 assessment
SCIAMACHY limb ozone data set • SCIAMACHY limb ozone profiles 2002-present (Sonkaew et al., 2009) • Version 2.1 • Altitude coverage: 10-70 km • Vertical resolution: 4 km • Relevance of data set: • WMO asessment 2010 • ESA climate change initiative ´ozone ecv´ (2010-2013) • merged limb/occ. ozone profiles (Ubr, KIT, FMI/LATMOS) from ENVISAT and ESA-Third Party missions (ODIN/ACE) • SPARC ozone profile initiative • trend quality ozone profile data sets Steinbrecht et al. 2009, WMO, 2010; Weber and Steinbrecht 2010
Long-term validation of SCIA O3 profiles • Comparison of monthly mean zonal means with SAGE II, HALOE, SABER, MLS, ACE-FTS • Direct comparison of zonal means (all profiles) all profiles
Long-term validation of SCIA O3 profiles • Comparison of monthly mean zonal means with SAGE II, HALOE, SABER, MLS, ACE-FTS • Comparisons of collocated profiles only (<400 km) • Results of all & collocated profile comparisons are similar, some fine details are different collocated profiles
Long-term validation of SCIA O3 profiles all profiles • SCIA overestimates in the UTLS (e.g. <20 km in the tropics) • General good agreement with solar occulation (HALOE, SAGE, ACE-FTS) to better than 10% • Larger differences wrt MLS (above 30 km) and SABER (extratropics) collocated profiles
Long-term validation of SCIA O3 profiles • SCIA overestimates in the UTLS (e.g. <20 km in the tropics) • General good agreement with solar occulation (HALOE, SAGE, ACE-FTS) to better than 10% • Larger differences wrt MLS (above 30 km) and SABER (extratropics) • sss
Long-term validation of SCIA O3 profiles • larger differences with MLS and SABER are significant (MLS bias confirmed by Considine et al., 2008) • small oscillation in the difference profile to solar occultation profiles are statistically significant residual tangent pointing problem most pronounced in the tropics (under investigation) • Question: Are the differences between SCIA and other instruments real? • Make a χ2-test null hypothesis check (von Clarmann 2006) using only random errors (error covariance of other instruments are unknown
SCIAMACHY tangent height offset 50oN– 70oN: ~7 m/year Tropics: ~21 m/year Retrieved from SCIAMACHY occultation measurements comparing the predicted and observed position of the Sun. Retrieved from SCIAMACHY limb measurements in UV spectral range using the “TRUE” algorithm (von Savigny et al., 2005).
SCIA instrumental O3 trends • Trend analysis (incl. Seasonal cycle, QBO, autocorrelation) • Siginificant negative trends at around 37 km (~-1%/decade) • larger trends than SABER • Most likely related to the residual tangent height problem
Conclusion O3 limb profiles • Excellent agreement with solar occulation data (< 10%) from 20 to 50 km • Strong overestimation below 20 km in the tropics • cloud interference (ca. 90% of all data) • Some statistically significant oscillatory structure in the mean difference profiles • Tangent height issue? • Negative trend of 1%/decade at about 37 km, larger than SABER‘s trend (~-0.4%/decade) • Tangent height issue
NO2 limb profile validation • NO2 limb retrieval V3.1 • Spectral range 420-470 nm • Vertical range 11-40 km • vertical resolution: 3-5 km • Retrieval grid: 1 km • Comparisons to SAGE II, HALOE, and ACE-FTS • Max. time difference: 8h • Max. distance: 500 km • Similar PV at 475 K (Bracher et al. 2004) • Difference in tropopasue height less than 2 km abpove 8 km altitude • SAGE II, HALOE, and ACE-FTS measurements are scaled to SCIAMACHY SZA using a 2D photo-chemical model (Bracher et al., 2005)
Comparison to SAGE II (2003-2004) • Good agreement at northern high latitudes above 20 km (<10%) • Increasing differences (up to 30% near 40 km) at low and soutrhern latitudes
Comparison to HALOE (2003-2004) • Good agreement at northern high latitudes above 20 km (<10%) • Increasing differences (up to 30% near 40 km) at middle and tropical latitudes • Similar results für SAGE II,HALOE, and ACE-FTS
Comparison to ACE-FTS (2004-2005) • Good agreement at northern latitudes (<10%) • Increasing differences (up to 30% near 40 km) at low and soutrhern latitudes • Similar results für SAGE II,HALOE, and ACE-FTS
Summary: NO2 limb profile • 60°N – 90°N altitude range all measurements agree mostly within 10% above 20 km. Below, SAGE II shows nearly the same results as SCIAMACHY, HALOE is lower and ACE- FTS is higher than SCIAMACHY • 30°N – 60°N altitude all measurements agree mostly within 10% above 20-24 km (depending on the reference instrument). Below, SAGE II and ACE- FTS are higher and HALOE is lower than SCIAMACHY • SCIAMACHY in most cases 10-15% higher than other satellites • High bias of SCIAMACHY is believed to be due to too low NO2 scaling factor resulting from the photochemical model for small solar zenith angles (confirmed by comparisons with the photo-chemical model of Chris McLinden) • Results show a better agreement than for the previous retrieval version (V3.0) reported by Bracher et al., 2005 (comparison was done only for 55N-69N latitude range).