Download
1 / 25
250 likes | 345 Views
File System Numbers. 4/18/2002 Michael Ferguson mpf7@cornell.edu. Why?. Make trace studies of filesystems to Inform development See trends in file system usage Ask these questions How do people actually use filesystems? What to they store and how do they access their data?

E N D
File System Numbers 4/18/2002 Michael Ferguson mpf7@cornell.edu
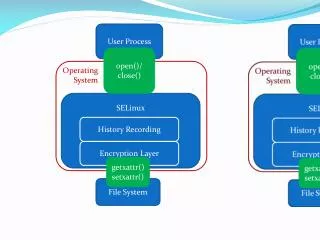
Why? • Make trace studies of filesystems to • Inform development • See trends in file system usage • Ask these questions • How do people actually use filesystems? What to they store and how do they access their data? • What caching strategies are best? • Filesystem statistics have wider implications • Network activity may depend on these filesystem statistics (think of a web server)
What data do we gather? • User activity – e.g. number of users, amount of data transferred? • File access patterns – e.g. was the file read sequentially from start to finish? • File lifetimes – e.g. what percentage of files exist for less than a second?
File System Trace Studies • BSD Numbers from 1985 (Ousterhout & others) • Sprite Numbers from 1991(Ousterhout & others) • Windows NT numbers from 1999 (Vogels)
The BSD Study - 1985 • Local BSD 4.2 filesystem on a 3 VAX-11/780s • Ucbarpa – used by graduate students for program development and document formatting – 4 Mb of memory • Ucbernie – used by grad students and by administration – 8 Mb of memory • Ucbead – used to run CAD programs for EE – 16 Mb of memory • Average file accesses only a few hundred bytes/sec/user • 75% of files open for less than ½ second • Many files only exist for a few seconds • File accesses tend to be sequential • Most file accesses are to short files but most bytes transferred are from large ones
Sprite Overview • Network-Oriented OS • File system servers and diskless workstations • Supports process migration
Sprite Study - Environment • 40 10-mips workstations running Sprite • 4 are fileservers • Memory averages 24Mb/workstation • Pmake commonly used to migrate processes and make use of idle workstations
Sprite Users • ~ ¼ OS researchers • ~ ¼ Architecture researchers design and simulate IO subsystems • ~ ¼ Researchers studying VSLI design and parallel processing • ~ ¼ Administrators, graphics researchers, and other people
Sprite – Measurement Approach • Instrumented kernels on file servers • Kernel records trace of activity (open, close, delete, lseek, etc but not read or write) • Kernel gives log to user process which records it in a file • Can deduce exact range of bytes accessed • lseek was modified to call file server • Removed trace-file records and tape backup records • Total statistics are gathered in-kernel • I’ll talk about results in comparison with Windows
Windows NT Measurements • 1998 – used 45 Windows NT 4 systems • Systems are used by one person at a time • Statistics are gathered with • File system snapshots • A transparent filter device driver for tracing
Windows NT Sprite File Lifetimes
Windows NT Sprite Sequential Runs - Comparison
Windows NT Sprite File Size Distribution - Comparison
Windows NT Sprite File Open Times - Comparison
Windows NT interesting notes • Time between sequential reads and writes different – 90 microseconds for reads, 30 microseconds for writes • 74% of sessions were opening files for control – not read or write • common operation checks whether or not the volume is mounted
Statistical Gotcha! • The data from the Windows NT trace is not a Poisson process – it is better modeled by the Pareto distribution
What does it mean? • There is extreme variance at all time scales • Mean and variance of request distribution does not stabilize over time! • Other components have heavy-tail distribution as well: • Process lifetime • Number of DLLs accessed • Number of files open per process • Spacing of file accesses
File Size Distribution • File Sizes are not normally distributed!
Bottom Line – WinNT traces • Although all systems were interactive and used by a single person at a time • 92% of file system operations were from processes that have no direct user input • Even explorer.exe’s behavior does not come directly from the user • “It is the structure and content of the filesystem that determines explorer’s file system interactions, not the user requests.”
Summary • We’ve followed several statistics through Sprite and Windows NT measurements • Network filesystems are still feasible but • Access is quite bursty • Most accesses are for controlling files • But beware! Several statistical assumptions about filesystems seem to be just plain wrong