Download
1 / 51
510 likes | 620 Views
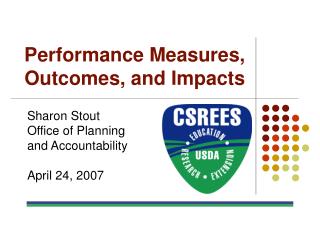
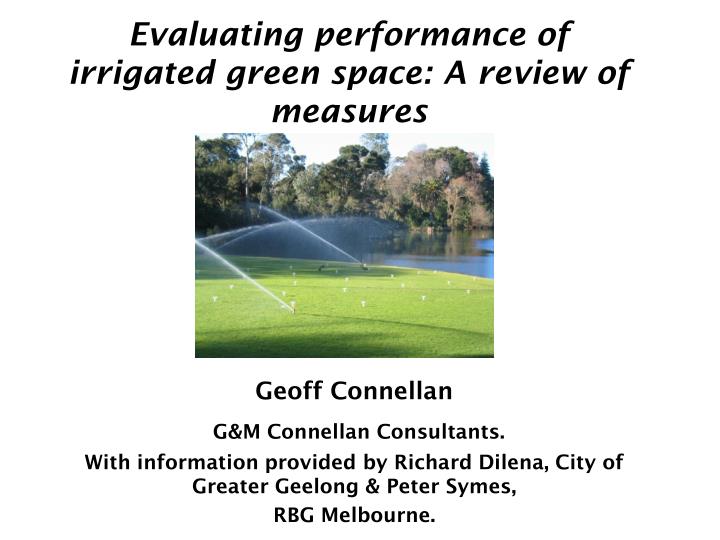
Evaluating performance of irrigated green space: A review of measures. Geoff Connellan G&M Connellan Consultants. With information provided by Richard Dilena, City of Greater Geelong & Peter Symes, RBG Melbourne. Ref: Irrigation Insights No 5. Fairweather, Austin & Hope, NSW Ag. NPSI.

E N D
Evaluating performance of irrigated green space: A review of measures Geoff Connellan G&M Connellan Consultants. With information provided by Richard Dilena, City of Greater Geelong & Peter Symes, RBG Melbourne.
Ref: Irrigation Insights No 5. Fairweather, Austin & Hope, NSW Ag. NPSI WUE “commonly used to describe the relationship between water (input) and the agriculture product” WUE is an Index WUE is used as a generic label for any performance indicators used to study water use in “crop production”. There are lots of efficiency terms. Including Water Use Efficiency (WUE)
Water Use and Irrigation Efficiencies 1. Water Use Efficiency Measure of Landscape Outcomes delivered per unit of water input. Strategy: Reduce plant water demand, E.g. Low water use/efficient species 2. Irrigation Efficiency Proportion of the water applied, that is delivered into the plant root zone.
OVERALL IRRIGATION EFFICIENCY APPLICATION EFFICIENCY SCHEDULING EFFICIENCY
IRRIGATION EFFICIENCY How much water gets into the root zone ?
Aim: High Application Efficiency Efficient Delivery into Root Zone
Aim: High Scheduling Efficiency Depth and Timing matched to daily ET ET
Assessment Individual Sprinkler Heads • Individual heads popped up • Heads assessed according to the potential fault categories:
Uniformity Testing Auditing – The Can Test
NOTE This discussion is based on Field or Operational performance measures. *Scheduling Coefficients (SC) and also *Christiansen Coefficient (CU) are important, particularly in terms of the design of systems.
Uniformity Testing - Calculating Field DU DU (%) = M25 x 100 M Where: M - average value of all catch can readings. M25 - average of lowest 25% of readings. *Field DU should be greater than 75%.
Precipitation Rate (PR) (a) Determined from a can test also (b) Calculated from sprinkler flow rate Valuable data * Validate system performance * Determine Irrigation Schedule
Calculating Precipitation Rate Depth (mm) Catch can - A very powerful performance tool!
Uniformity of ApplicationCan test readings – Volume (mL) Lowest:12 mL Highest: 54 mL
Uniformity Results For example: New irrigation systems: Field DU Should be > 75% Existing systems: If DU < 75% System should be repaired or adjusted. Existing systems: If DU < 60% System should be replaced.
DU as an Efficiency Measure It is not strictly a measure of efficiency. It is an Index Does it matter? • For communication and management – No. (2) For scientific analysis and water balance – Yes.
It is the distribution of water in the soil that is important !
Comment: DU as an Efficiency Measure Example – Low DU and High Efficiency System with poor uniformity, application depth less that that required to refill the root zone, all the water taken up by plant roots. It is High Efficiency! (By some measures)
RBG System Fix - Before Before DULQ : 55% SC 25%: 1.81 81% extra water required.
RBG System Fix - After After DULQ 79% SC 25% 1.26 26% extra water required
Measurement of Water Use All irrigated sites need to have dedicated water meters. . Central control and PC based systems, together with digital flow meters, provide comprehensive water use data.
Reporting Water Consumption • Volume totals – ML • Trends and Reference years - % change, higher, lower • 3. Application Rates (ML/ha) compared to industry standard. • * Greater exposure of Application Rates would be beneficial.
Water Use Reporting Water Budget Water Used Water Required
Water Use Reporting Inefficiency Water Used - Meter Water Required - Actual Water Budget - Average
Irrigation Index – Efficiency Indicator The Irrigation Index (Ii) What is: Water used relative to Water required (volume)? .
Reporting Water Use PerformanceIrrigation Index RBG Melbourne
Case StudyReserve Irrigation Report Richard Dilena City of Greater Geelong
Sample: Irrrigated site reportRichard Dilena, City of Greater Geelong • Performance Parameters • Irrigation index • Irrigation efficiency • Visual assessment • % of water budget used
Sample: Irrrigated site reportRichard Dilena, City of Greater Geelong
It is more than the water! What is the performance of the green space?
Benefits and Value of Irrigated Green Space (1) Social (2) Environmental (3) Economic
Physical HealthRecreation - Green Space Active Recreation Passive Recreation
Social Benefits: “User hours or player hours” Identifying Services or Outcomes Provided.Example: Redleap Reserve, Whittlesea Services provided: AFL 11,500 Player hours Cricket 6,700 Player hours Total: 18,200 Player hours Water productivity: 3,600 player hours per ML
Exercise/Recreational Benefits Dept. Health, Vic. Boeing Reserve, City of Moonee Valley Stormwater development of site. Sporting ovals, baseball, grasslands, woodlands
Health Benefits from Green Space • Physical health benefits: • $400,000 (Approx.) per year • Other health benefits • Mental health: Reduction in stress levels. • Social benefits: Social cohesion, Liveability, • Reduced rates of violence. • Environmental benefits: Urban heat island (UHI) mitigation
Cost Benefit Analysis – Green space Evaluated over 10 years Community benefit: $4 million (Approx.) Environmental benefit: $185,000 (Approx. Costs: $3 million (Approx.) Net benefit of green space: $0.8 million
RBG Melb. Irrigation Water Productivity 70 Litres per visitor. Photo: Jorge de Arujo, RBG What is the $ value of the benefits?
Efficiency Reference Water Use Efficiency For Irrigated Turf and Landscape Geoff Connellan CSIRO Publishing Website: http://www.publish.csiro.au/pid/5263.htm