Download
1 / 2
20 likes | 80 Views
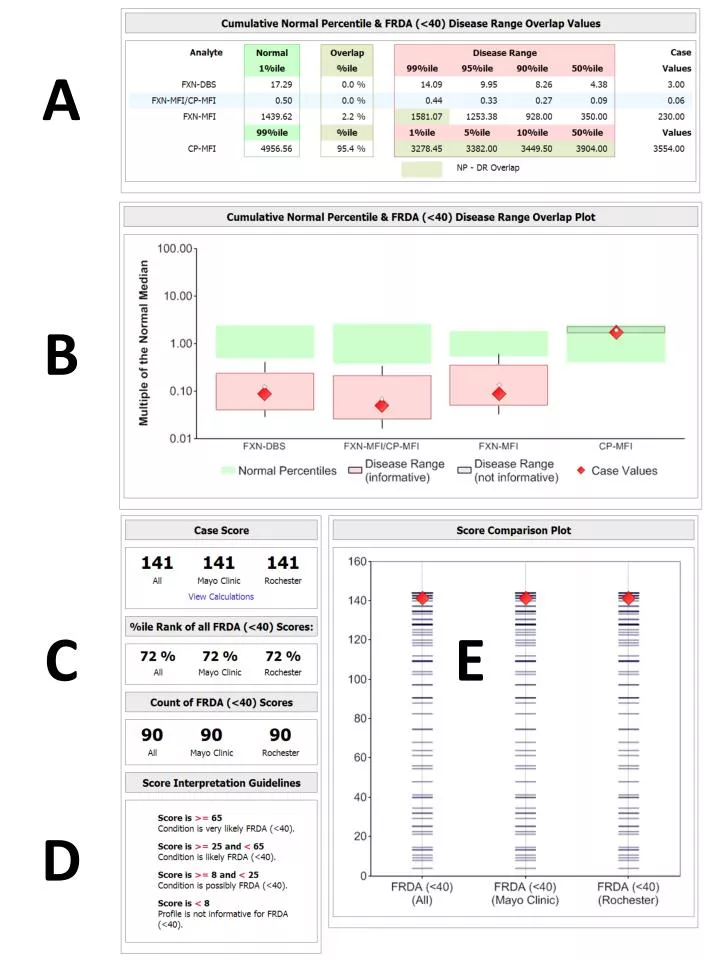
A. B. C. E. D. Supplemental Figure 4. An example of a post-analytical interpretive tool for FRDA (age <40 yr).

E N D
A B C E D
Supplemental Figure 4. An example of a post-analytical interpretive tool for FRDA (age <40 yr). The results are from the patient described in the Case Report section. A: list of analytes and case values, the 1st percentile of reference ranges (shown are markers that are informative when decreased), degree of overlap between the reference and disease range (0% indicates no overlap), and selected percentiles of disease range on the side in proximity to reference range, plus the median. B: comparison of patient values (red diamonds), reference range (green) and disease percentiles (red) on a log-scale after conversion to multiples-of-the-reference median. C: calculated score, percentile rank of all FRDA (<40) scores, and count of cases included in the disease range. D: interpretation guidelines. A score lower than the 1st percentile of all scores calculated in confirmed cases is considered uninformative, a score between the 1st and the 10th percentile is possibly informative. Any score greater than the 10th percentile is increasingly likely to reflect a positive case. Scores that are greater than the 25th percentile are self-evident and do not constitute a diagnostic challenge. E: score comparison plot. To date, only data from one site (Rochester) have been uploaded to the database and the distribution of scores is identical for the site, the first level aggregator (Mayo Clinic), and the whole project. For more information about this tool, see reference 19.