Download
1 / 34
340 likes | 587 Views
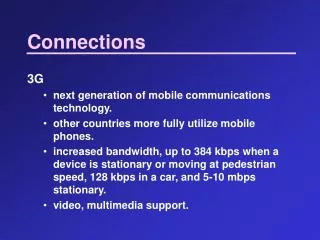
Accountability Connections:. National Perspectives on The Big 8 Puzzle for State & Local Educators. National Data Accountability Center, LSU Health Sciences Center. W. Alan Coulter, Ph.D. www.accountabilitydata.org acoulter@lsuhsc.edu. 60’. Working Premises. 6.

E N D
Accountability Connections: National Perspectiveson The Big 8 Puzzle for State & Local Educators National Data Accountability Center, LSU Health Sciences Center W. Alan Coulter, Ph.D. www.accountabilitydata.orgacoulter@lsuhsc.edu 60’
Working Premises 6 • What Gets Counted Gets Done. • Attention Paid Indicates Relative Importance. • We know More than We Know. • A Goal that Can’t be Measured is Just a Slogan. 10/21/2014 2
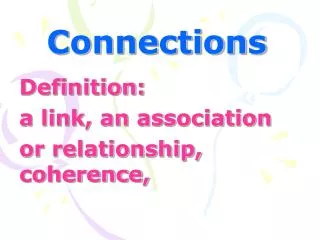
9 Diploma Rate Class of 2005All Students(Top and Bottom 10 ranked States) (National Average = 70.6% ) 80.2% (5) 68.8% 79.2% (7) 52/57 78.1% (9) 80.5% (3) 78.1% (9) 80.4% (4) 82.8% (2) 83.3% (1) 79.6% (6) 45.4% (51) 60.1% (45) 78.6% (8) 57.6% (47) 54.1% (50) 55.6% (48) 61.3% (43) 58.1% (46) 61.8% (42) 54.7% (49) 60.8% (44) Largest % of students exiting with a diploma Smallest % of students exiting with a diploma Diplomas Count 2008: School to College: Can State P-16 Councils Ease the Transition? http://www.edweek.org/ew/toc/2008/06/05/index.html
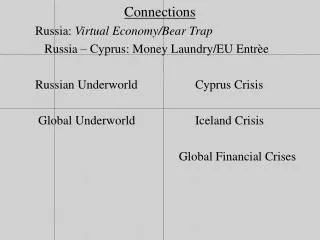
DIPLOMA COUNTS, 2006 (National Average = 69.2%) 77.0% (10) 78.7% 62.4% (7) 79.0% (43) 46/49 79.2% (5) (4) 77.1% 81.7% 76.8% 78.9% (9) (2) (11) 77.6% (6) 80.7% (8) 82.1% 78.7% (3) (1) 47.3% (7) D.C. (51) Palau 63.3% (42) 48.8% Guam (50) 56.0% 61.4% 55.9% (48) 60.5% V.I. (45) (49) (46) 63.9% 61.9% 57.5% (41) (47) (44) Marshall Is BIE Micronesia Top 11 N. Marianas Source: Edweek.org, Graduation Rates 2006 Bottom 11
10 5 5
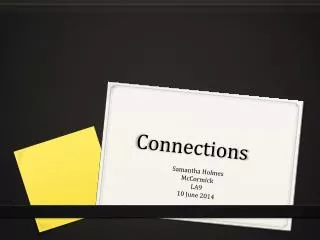
Diplomas for Disabilities FFY 2004-07 Cohort Extended Rate Target = 68% Performance = 69.1%
DropOuts for Disabilities, FFY 2004-07 Target = 6.0 % Performance = 6.8 % How Can We Use These Data to Improve Results ?
What’s the Landscape of Accountability ? And How Can You View It ?
What Congress Intended – IDEA’04 (Parts B & C) • Better Results • Proper Administration (‘General Supervision’) as the ‘Method’ • Unified System of Accountability as the ‘Measures’ It’s all about Methods, Measures, & Results.
Emphasis on Balance in IDEA’04 • “The primary focus of Federal and State monitoring activities described in paragraph (1) shall be on— • ‘‘(A) improving educational results and functional outcomes for all children with disabilities; and • ‘‘(B) ensuring that States meet the program requirements under this part, with a particular emphasis on those requirements that are most closely related to improving educational results for children with disabilities.”
What Congress Intended – IDEA ‘04 Unified System of Accountability - • Measurable (Indicators) • Rigorous (targets & progress) • Transparent (understood) • Publicly Reported (posted) • Connected (national-state-local) • Consequences (determinations, etc.)
Individuals With Disabilities Education Improvement Act, ‘04 The Balance between Process and Results
(New) SpEd Compliance Compliance = (FAPE) Educational Processes& Results(Educational Benefit) (OSEP’s Related Requirements document) Culture of Procedural Culture of Results Compliance Compliance (Results = Compliance)
Specifically, What Does I.D.E.A. ‘B’ Require? “There are 755 specifically required compliance items” Chris Drouin, CDE, count of items on the ‘OSEP Checklist. Ex: 755+ items x 6,750,000+ students with disabilities x 180+ days = compliance with federal law. This has NOT Changed !(No One has ever counted all the Part C Requirements)
Here’s the Rub … What do we have show for all our advocacy and best intentions ? You can be in compliance with all 755 required items and not be achieving results for students with disabilities. Too many requirements Trivialize Special Education by making compliance Impossible.
How Does IDEA ’04 Balance Process & Results and Unify Accountability? • State Performance Plans& Annual Performance Reports • 20 Indicators & Rigorous Targets • Public Reporting & Status Determinations • Focused Monitoring • Continuous Progress v. Consequences It’s all about Methods, Measures, & Results.
Accountability within IDEA-B • 3 Priorities in Part B • FAPE in the LRE • General Supervision • Disproportionality • 20 Indicators (the ‘measurables’) • 14 applicable to LEAs • 20 applicable to each state It’s all about Methods, Measures, & Results.
Timely Evaluations • Part C to B • Transition Prep • Post School Outcomes • Corrected Noncompliance • Resolved Complaints • Due Process • Resolutions • Mediations • Timely Data 20 Fed Indicators • Diploma • Drop-out • Participation/ Performance + • Suspension (4A) (4B) • LRE • LRE preschool • Preschool Outcomes* • Parent Involvement • Disproportionality • Big 6 of Disproportionality+ Lilac = Maybe 2010 Rigorous Targets
Status Determination (OSEP for States; States for Locals) • Meets Requirements (?) • Needs Assistance (?) • Needs Intervention (?) • Needs Substantial Intervention (?)
2007Part B OSEP DeterminationsState Implementation of IDEA American Samoa Guam Northern Marianas D.C. Palau Puerto Rico Marshall Islands B.I.A. V.I. Micronesia Meets Requirements Needs Assistance Needs Intervention Source: www.ed.gov
2008 Determinations – Part B American Samoa Guam Northern Marianas D.C. Palau Puerto Rico Marshall Islands B.I.E. V.I. Micronesia Meets Requirements Needs Assistance Needs Intervention Source: www.ed.gov
2009 Determinations – Part B American Samoa Guam Northern Marianas D.C. Palau Puerto Rico Marshall Islands B.I.E. Meets Requirements V.I. Micronesia Needs Assistance Needs Intervention Needs Assistance- 2 consecutive years Source: www.ed.gov Needs Assistance- 3 consecutive years Needs Intervention- 3 consecutive years
National to State to Local General Supervision • The ‘National’ Does Not Control Improvement of Results – Dependent on States(What can the ‘National’ Do?) • The ‘State’ Does Not Control Improvement of Results – Dependent on Locals(What can the ‘State’ Do?) • Improvement of Results Must Occur at Local Levels It’s all about Methods, Measures, & Results.
National to State to Local General Supervision • Locals Share the job of General Supervision • General Supervision is the Management & Leadership Structure for Improving Results It’s all about Methods, Measures, & Results.
The BIG 8 of General Supervision (and Continuous Improvement) • What are the minimum Components for General Supervision ? • How do the Components form a state System ? • What are the annual Processes operating within the system ? It’s all about Methods, Measures, & Results.
Difference between Concepts & a Model Each state develops Its Own Model of General Supervision based on what’s required and desired WA SEAC & Task Forces
Components of General Supervision Policies, Procedures, and Effective Implementation State Performance Plan Ask Yourself How Each Piece Operates and Fits Into the Whole Integrated Monitoring Activities Data on Processes and Results Fiscal Management Improvement, Correction, Incentives & Sanctions Targeted Technical Assistance & Professional Development Effective Dispute Resolution
Accountability’s Big View Pt. B State Performance Plan Policies, Procedures & Effective Implementation State Plan for NCLB Data on NCLB Student Performance & AYP Data on Processes and Results How Does the Big 8 Fit Into a State System? Fiscal Management Integrated Monitoring Activities Improvement, Correction, Incentives & Sanctions Targeted Technical Assistance & Professional Development Reading First Technical Assistance & Professional Development Effective Dispute Resolution Improvement, Correction for NCLB What accountability requirements for other programs have?
Policies, Procedures, and Effective Implementation State Performance Plan What is a ‘System ?’ Data on Processes and Results Integrated Monitoring Activities Fiscal Manage-ment Targeted T/A & Professional Development Effective Dispute Resolution Improvement, Correction, Incentives & Sanctions
General Supervision Policies, Procedures, and Effective Implementation State Performance Plan Integrated Monitoring Activities Data on Processes and Results Fiscal Management Improvement, Correction, Incentives & Sanctions Targeted Technical Assistance & Professional Development Effective Dispute Resolution Big 8
Difference between Concepts & Your Model Each Local Program develops Their Own Model of General Supervision based on what’s required and desired
Expected Outcomes for BreakOut Session - Coming Next Participants will: • Understand the purpose of Washington state’s systems of General Supervision • Identify the minimum components of a local system of general supervision • Determine the appropriate steps necessary to assess and refine a local system of general supervision It’s all about Methods, Measures, & Results.
We’re Done for this Session! acoulter@lsuhsc.eduwww.accountabilitydata.org