Download
1 / 15
160 likes | 344 Views
Genome Structure/Mapping. Lisa Malm 05/April/2006 VCR 221. Genome Structure/Mapping. Characteristics of the tomato nuclear genome as determined by sequencing undermethylated EcoRI digested fragments Want et al. 2006

E N D
Genome Structure/Mapping Lisa Malm 05/April/2006 VCR 221
Genome Structure/Mapping • Characteristics of the tomato nuclear genome as determined by sequencing undermethylated EcoRI digested fragments • Want et al. 2006 • Development of a set of PCR-based anchor markers encompassing the tomato genome and evaluation of their usefulness for genetics and breeding experiments • Frary et al. 2005 • Zooming in on a quantitative trait for tomato yield using interspecific introgressions • Fridman et al. 2004
Characterisitics of the tomato nuclear genome as determined by sequencing undermethylated EcorRI digested fragments • What is CpG and CpNpG methylation? • Methylcytosine • Previous studies of unmethylated DNA • Focused on monocots • Focus of Study
950 Mb of DNA 25% in gene-rich euchromatin @ distal ends of chromosomes 75% in gene-deficient heterochromatin One of the lowest G+C contents of any plant species An estimated 23% of the cytosine residues are methylated The Tomato Genome
Estimating the size of the unmethylated portion of the tomato genome based on EcoRI digested fragments • Detailed analysis of coding UGIs • Undermethylated portion extends 676 bp upstream and 766 bp downstream of coding regions • 59% non-coding sequences, 12% transposons, and 1% organellar sequences • Organellar sequences integrated into the nuclear genome over the past 1 million years • Accounts for majority of unmethylated genes in the genome • Estimated to constitute 61 15 Mb of DNA (~5% of the entire genome) • Indicates a significant portion of euchromatin is methylated in the intergenic spacer regions
310,000 sequence reads estimated to cover 95% of the unmethylated tomato gene space Solanaceous species have same basic chromosome # as tomato (n=12) Similar chromosome structure Similar gene content Assume methylation patterns also similar Possible to apply methylation filitration sequencing to genomes of other solanaceous species Use order of tomato sequence and synteny maps to determine derived order of UGI genes Implications for sequencing the genome of tomato and other solanaceous species
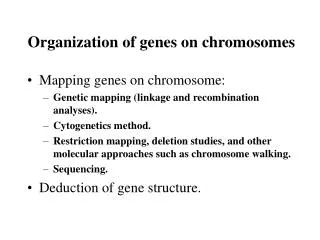
Development of a set of PCR-based anchor markers encompassing the tomato genome and evaluation of their usefulness for genetics and breeding experiments • Genetic mapping of morphological traits in tomato began in 1917 • Additional types of molecular markers • Alternatives to RFLPs • Cheaper, faster, less labor intensive • Lack of PCR based map • Map containing PCR-based markers would benefit many studies • Goals of this Study
Consist of SSRs and CAPs, based on single-copy/coding regions Encompass entire genome, placed at regular intervals, anchored in linkage map Priority given to established polymorphism markers. Criteria: Detection of polymorphism Visualization of polymorphism Placement of markers on map Additional SSR markers PCR-based anchor markers
PCR Based Anchor Map of Tomato • 76 SSRs placed on S. lycopersicum x S. pennelli high density map • 76 CAP markers also mapped • 152 PCR-based anchor markers • Uniformly distributed • Encompass 95% of genome • Locus specific
Applications • Useful for mapping in other interspecific populations • Useful resource for: • qualitative and quantitative trait mapping • Marker assisted seletion • Germplasm identification • Genetic diversity studies in tomato
Zooming In on a Quantitative Trait for Tomato Yield Using Interspecific Introgressions • Previous QTL Projects • Multiple Segregating vs Single Region Segregating QTL • Single region segregating QTL (ILs) have higher genetic resolution • Increased identification power for QTL analysis
Exploring Natural Tomato Biodiveristy • Developed and examined a population of 76 segmented introgression lines • Utilized QTL database • Examined total soluble content of tomato fruit in “ketchup tomatoes” measured in refractometer brix (B) units
QTL improves B w/out reducing total yield Restricted to SNP defined region of 484 bp of cell wall invertase LIN5 3 amino acid differences, Asp366, Val373, and Asp348, are responsible for QTL effects LIN5 exclusively expressed in conductive tissue of flower reproductive tissues Supports role of LIN5 as “sink gene” Characterizing the QTL Brix9-2-5
Maps to middle of short arm of chromosome arm But not present at this location in any of the 5 populations All lines share 2 of 3 amino acids Evaluated QTN SNP28378 Responsible for ASP348 substitution Role of ASP348 and SNP28378 Characterizing the QTL Brix9-2-5
Conclusions • Example of the ability of a diverse IL to provide detail information on a QTL involved in increased sugar yield in tomatoes