Download
1 / 41
410 likes | 548 Views
A Distributed Energy Saving Approach for Ethernet Switches in Data Centers. Weisheng Si 1 , Javid Taheri 2 , Albert Zomaya 2 1 School of Computing, Engineering, and Mathematics, University of Western Sydney 2 School of IT, University of Sydney. Outline. Background Related work

E N D
A Distributed Energy Saving Approach for Ethernet Switches in Data Centers Weisheng Si 1, Javid Taheri 2, Albert Zomaya 2 1 School of Computing, Engineering, and Mathematics, University of Western Sydney 2 School of IT, University of Sydney
Outline Background Related work Main idea of our approach Details of our approach Evaluation Conclusions
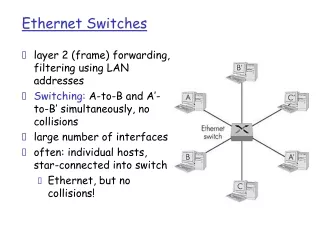
Energy consumption of data centers • Data centers (DCs) contribute a significant portion of global electricity consumption. • DCs mainly consist of • Servers: consuming about 60% of the total energy • Ethernet switches (shortened as switches hereafter): consuming about 10%-20% • Infrastructure(distribution, cooling, etc.): 20%-30% • This paper considers energy saving for switches
Importance of saving energy in switches • The percentage of energy consumed by switches will grow considerably in the near future. • To accommodate peak traffic load, the network topologies of DCs have to employ a rich connectivity of switches. • For instance, the fat tree topology • The peak-traffic time in DCs is much shorter than the non-peak time.
The Fat Tree Topology • Three levels of switches, bipartite graph in each pod
Outline Background Related work Main idea of our approach Description of our approach Evaluation Conclusions
Hardware features for energy saving There are altogether three hardware features exploited by the existing approaches to save energy: Idle an entire switch Idle a port Adaptive Link Rate (ALR)
Centralized approaches Most of the existing approaches are centralized approaches. They assume a central controller who knows global information including The entire network topology The traffic rates among the servers in DCs They obtain an NP-hard problem and propose heuristics to solve the problem. They show that their heuristic algorithms can achieve close results to the optimal solutions.
Limitations of centralized approaches • Because a central controller needs to collect the global information and then distributes the calculated results, the centralized approaches suffer from the following limitations: • They cannot quickly respond to the traffic change in DCs • They are not scalable.
Outline Background Related work Main idea of our approach Description of our approach Evaluation Conclusions
Power model IEEE approved the Energy Efficient Ethernet as a standard (IEEE Std 802.3az) in 2010. In this standard, a new state for ports called Low Power Idle (LPI) is introduced and the mechanisms for entering and exiting LPI are defined. Therefore, we assume a port has two states: idle and active. Also assume a switch has two states: idle and active.
Power model (cont’d) The formula for calculating the power consumed by a switch: There is a penalty for the port state transition between idle and active: this transition takes a short period of time, during which no packets can be transmitted and the same amount of power is consumed as the active state.
We proposed a distributed approach • We refer to our approach as eAware hereafter. • The main idea of eAware is as follows: • Each switch monitors the queue lengths and utilizations at its ports; • If the queue length at a port exceeds certain threshold, certain other ports will be activated; • If a port has a zero queue length and its utilization is below certain threshold, this port will be made idle; • If all ports on a switch are idle, the entire switch will be made idle.
Why examining queue length? • Energy saving should not considerably impair the network performance of DCs. • The most important metrics on network performance are: • Packet end-to-end delay • Packet loss ratio • Both of them are closely related to queue length: • Long queues lead to long end-to-end delays • If queue length is close to buffer capacity, packet drops are prone to happen.
Why examining utilization when idling a port? • A port can have a zero queue length but a high utilization at the same time • E.g., when a port transmits a network flow which has a constant bit rate slightly less than the port capacity. • Measuring utilization needs a period of time, which can prevent ports from oscillating between idle and active states too frequently.
Outline Background Related work Main idea of our approach Details of our approach Some concepts The increasing port algorithm The decreasing port algorithm Evaluation Conclusions
Some concepts Port order: we stipulate an order on the ports of a switch as their order of appearance from left to right in a network topology. We require the network topology satisfies that if port i appears left to port j in a switch, port i will connect to a switch appearing left to the switch that port j connects to. The idea here is to consolidate traffic to the ports and switches in the left, such that the ports and switches in the right can idle to save energy. Port ID: to indicate the above order, if a port p appears left to a port q on a switch, port p has a smaller ID than port q.
Some concepts (cont’d) port utilization: the traffic transmission rate at a port during certain period divided by the capacity of this port. Its value ranges between 0 and 1. utilization period: the period for measuring the port utilization. high_length: the threshold of the queue length to trigger the increase of active ports. low_util: the threshold of the port utilization to trigger the decrease of active ports when the queue length is zero.
Some concepts (cont’d) port state constraints: (1) if port u becomes active, port v must also become active; (2) port u can idle only when portvcan also idle. The signaling between ports uandvto maintain these two constraints is supported by the link layer mechanisms in IEEE Std 802.3az. Separation of routing algorithm and our algorithms The routing algorithm will be unaware of the active/idle states of the ports. U V
Separation of routing algorithm and our algorithms The routing algorithm maintains the routing table • Our algorithms will maintain the active/idle states of ports and decide to which port to forward a packet
The increasing port algorithm This algorithm is invoked after the routing table lookup for every packet, dealing with the increase of active ports. • Reasons for invocation for every packet: • Only after the routing table is looked up for a packet, we know which ports can be used to forward this packet and thus which ports should be made active to alleviate long queues if present. • The queuing delay of a packet should be reduced whenever possible.
The increasing port algorithm (cont’d) Input: (1) a packet and (2) the n ports returned for this packet from the routing table. Output: (1) the port for forwarding this packet and (2) a port to activate if there should be one.
The increasing port algorithm (cont’d) Assume m of these n (m≤n) ports are currently in active state. One of these m active ports is selected as the port (denoted by port f hereafter) for forwarding this packet. After sending this packet to the buffer of port f, if queue length of port f > high_length, go to step 3. Otherwise, the algorithm ends here. If all nports are currently active, the algorithm ends. Otherwise, determine the leftmost idle port (denoted by port u hereafter) among those n ports. Set port u to active and also signal port v to become active.
The decreasing port algorithm This algorithm is invoked every utilization period, dealing with the decrease of active ports. This algorithm is triggered by a periodical timer instead of packet arrivals, because a port should be able to become idle even when no packet arrives.
The decreasing port algorithm (cont’d) Input: the queue length and utilization of each port on this switch. Output: the list of ports to idle. • For each port u in this switch, execute the following steps. • Calculate the utilization of port u. • If (port u is active ) and (queue length of port u = 0) and (utilization of port u < low_util): • Signal port v to see whether port v can idle. • If (queue length of port v = 0) and (utilization of port v < low_util), both ports u and v transit to idle state. Otherwise, both ports stay in active state.
Outline Background Related work Main idea of our approach Details of our approach Evaluation Conclusions
Experiment Setup We implemented eAware using the network simulator ns-2, and made the source codes available at my homepage. We compare eAware with the approach described in the fat tree paper which considers no energy saving. Hereafter, we label this approach eOblivious. Without loss of generality, the fat tree topology is used as the network topologies. Pareto traffic generator shipped in ns-2 is used to generate the network traffic.
Parameter variations number of pods: we use four values of 4, 6, 8, 10. Note that a larger number of pods implies a greater redundancy of switches in a network. traffic_rate: we use six values of 50M, 100M, 150M, 200M, 250M, 300M. (high_length, low_util): we use three pairs of threshold values: (125 pkts, 0.25), (25 pkts, 0.05), and (5 pkts, 0.01). Note that the first pair of values favors the most on energy efficiency and the least on network performance, and the last pair, vice versa.
Evaluation Metrics Percentage of energy saving • Percentage of packet end-to-end delay increase • Percentage of packet loss increase
Conclusions This paper proposedeAware, a distributed approach based on queue length and utilization to idle/activate ports and switches to save energy for DCs. Due to its distributed and localized nature, eAware can quickly adapt to the traffic changes in DCs and is also scalable.
Conclusions (on experiments) EAware can save 30%-50% energy compared with the energy oblivious approach. EAware increases the average packet end-to-end delay by 3%-20%, and the packet loss ratio by 0%-0.9%, thus only impairing the network performance slightly. If the two thresholds high_length and low_util are set to very low values,eAwarecan achieve similar network performance to the energy oblivious approach but can still save energy in those long periods of low traffic load.
Conclusions (a discussion) EAware is independent of the multipath routing protocols adopted by DCs, which brings the advantages of: Simplicity Portability A further reason that we do not combine eAware with the multipath routing protocol (e.g., making queue length and utilization part of the routing messages) is: The queue length and utilization at a switch port (especially the former) can change quickly in a DC environment, while the period of sending routing messages (usually 30s) is too long to propagate these two metrics. Need to experiment to find out. Theoretically model the approach