Download
1 / 23
230 likes | 329 Views
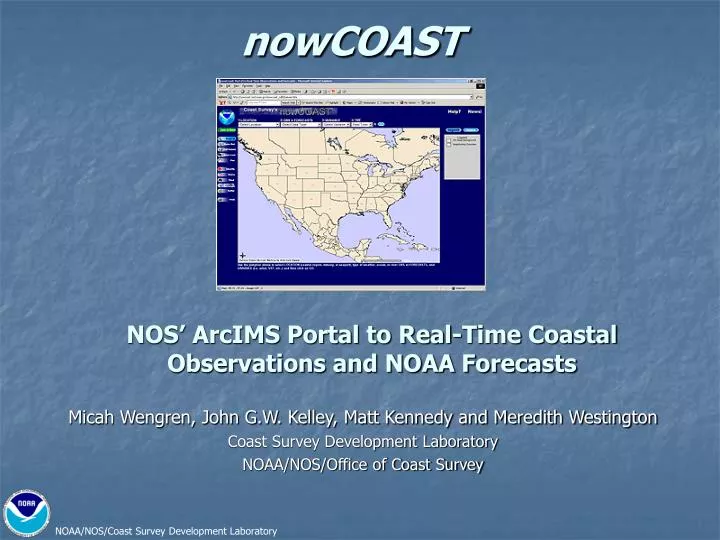
nowCOAST. NOS’ ArcIMS Portal to Real-Time Coastal Observations and NOAA Forecasts. Micah Wengren, John G.W. Kelley, Matt Kennedy and Meredith Westington Coast Survey Development Laboratory NOAA/NOS/Office of Coast Survey. Why was a portal needed?.

E N D
nowCOAST NOS’ ArcIMS Portal to Real-Time Coastal Observations and NOAA Forecasts Micah Wengren, John G.W. Kelley, Matt Kennedy and Meredith Westington Coast Survey Development Laboratory NOAA/NOS/Office of Coast Survey
Why was a portal needed? • Every coastal observing network and NOAA forecast product has its own web interface. • No single site provides a map-based view of all real-time observing station locations and NOAA forecast sites. • Result: lots of time spent navigating websites. • An integrated web site was needed to view real-time coastal observations and NOAA forecasts using a dynamic map interface with live web links.
What is nowCOAST? • An Arc Internet Map Server (IMS) based web mapping portal to improve access to real-time coastal information. Goal: • Provide marine community with new means of access to all on-line, real-time weather, ocean, and river observations and NOAA forecasts for U.S. coastal areas. How: • Provide live web links to the websites displaying this information • User-specified dynamic map views of station and forecast locations • Ease of use for broad user base: GIS and non-GIS experienced *nowCOAST was first available online in August 2002
nowCOAST’s Navigation Capabilities:Using the Jumpbar • Quick access to information in • 4 steps: • Specify a location– • divided by coastal regions, estuaries, lakes, or sea ports • 2)Specify a type of information-observations data, forecast model guidance, and surface forecasts • 3) Specify a variable • 4) Specify time • 5) Hit “Go” button As depicted above, a user has selected to display weather/ocean observations stations in the Chesapeake Bay with a highlight on those stations that provide air temperature values.
nowCOAST’s Links to Real-Time Observations: Spatially-referenced links to data from the following networks: • Weather and Ocean Observations: • National Weather Service: • NWS/FAA/DOD Airfield Observations (ASOS/AWOS) • National Climate Data Center • US Climate Reference Network (CRN) • National Data Buoy Center: • Data Buoys • C-MAN Stations • National Ocean Service: • PORTS • NWLON – Water Level • Many land mesonets and regional observing systems: • UMD’s CBOS • Texas A&M’s TABS • GoMOOS • LISShore Network • Rutger’s LEO-15 • CORIE • Caro-COOPS • ICON • LUMCON • River Observations: • USGS River Stations • Surface Currents: • CODAR networks from several universities • Weather Radars: • NWS Doppler Radar Sites • Upper Air Data: • Radiosondes • Boundary Layer Profilers • Water Quality: • EPA EMPACT • USGS River Network • Maryland DNR • NEOCO • PWSN • SEAKEYS-CREWS • USF COMPS • TCOON • WAVCIS • GLERL Network • SABSOON
nowCOAST’s Links to Forecasts and Predictions: Spatially-referenced links to data from the following forecasts: • National Weather Service Forecasts: • County Forecasts • Surf Zone Forecasts • Coastal and Offshore Marine Zone Forecasts • High Seas Forecasts • NWS & NOS Forecast Model Point Guidance • WaveWatch III • Extra-Tropical Storm Surge • Model Output Statistics (MOS) • Estuarine Forecast Models • NWS River Forecast Guidance: • Advance Hydrological Prediction Service (AHPS) River Forecasts • Astronomical Tidal Predictions: • NOS Tidal Predictions
HTML ----- JSP New nowCOAST viewer design based on the ArcIMS Java Connector and server-side Java code (Servlet/JSP): JSP Viewer Advantages: • Better customization: easier, more powerful • Less computational load on client: more stable • Lightweight viewer: less code to download, quicker access
Java Connector vs. Servlet Connector jspForm.jsp: • Hidden form that is submitted to server with information about map request • Java code resides on server to handle this input and generate ArcXML • No ArcXML must be generated by client: eliminates need to download large JavaScript libraries present in HTML viewer • Quick download for low-bandwidth • Fewer points of failure due to client-side processing • Develop custom map functionality using Java Connector API and power of Java language • No need to directly write ArcXML • More stable client viewer
nowCOAST JSP Viewer Design Larger Map View • Moved tools to bottom of map to increase space available for map
nowCOAST JSP Viewer Design New Frame with Interactive Map Tool Information • Text with information about tool function • Same space used for capturing user input for certain tools: Print, Zoom to Lat/Lon • Button to link to separate window with more detailed instructions on how to use tools
nowCOAST JSP Viewer Design Customized dbGroupTOC Table of Contents Interface • Adapted from ArcScript by Dave Bollinger • Popular TOC code used in many ArcIMS sites • Highly customizable
nowCOAST JSP Viewer Design Customized dbGroupTOC Table of Contents Interface • Combines legend with layer list to eliminate need to display standard ArcIMS legend image • Customizations: • option for users to open separate window with detailed description of content of each layer • option for auto map refresh when a layer’s visibility is changed
nowCOAST JSP Viewer Design nowCOAST ‘Jumpbar’ • Works in unison with GIS tools to allow for control of map via either interface
nowCOAST Databrowser New feature to manage user interaction with nowCOAST • Session-based ‘History’ object • Stores record of websites linked to, select, identify, and query results • Kept on server for session duration, accessed via a JSP interface • Databrowser – JSP interface to access History: • Familiar back, forward control mechanism similar to web browser • Allows navigation of nowCOAST History – each new request made to the database is a new ‘Record’ in the History • Display either hyperlinks to outside websites or nowCOAST database tables with results from select, identify, and query requests • Designed as a data ‘companion’ to map viewer Preliminary Design • Limited by session timeout • Possible improvements include ways to reload History for returning users
nowCOAST Databrowser • Display hyperlink to observation or forecast website in second frame below main navigation frame
nowCOAST Databrowser • Also display nowCOAST database tables with results from: • Query • Select by Rectangle • Identify • Option available in database table to hyperlink to website with observation/forecast data for each feature • Allows use of Select by Rectangle tool to highlight several stations in an area and choose which to view data from based upon information in database table
nowCOAST Databrowser Navigation Frame • Provides useful information about record: • Record number • Map layer that was active during request • Station or forecast area name if it is a hyperlink • Familiar Back/Forward browsing to move from record to record • Buttons to return to nowCOAST map, print data or hyperlink page in bottom frame, and open hyperlink in another window
Custom Tools for nowCOAST JSP Viewer Several tools had to be built from scratch for JSP viewer • Query Interface • Zoom to Lat/Lon • Print Page • Zoom to Last Extent • Link to Data
http://nowcoast.noaa.govAdditional information and materials availableContact:Micah.Wengen@noaa.govJohn.Kelley@noaa.gov Check it out!