Download
1 / 18
230 likes | 595 Views
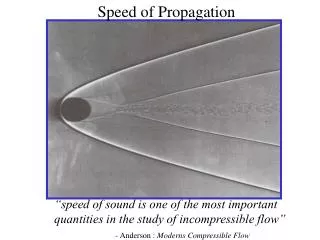
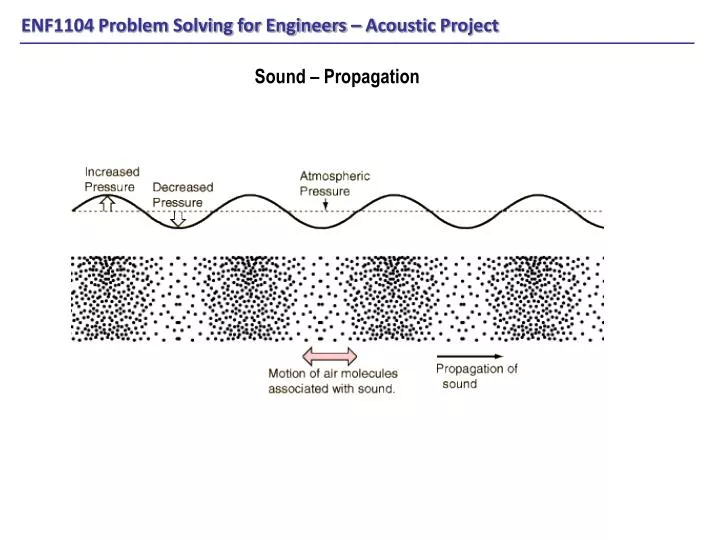
Sound – Propagation. Sound Levels Sound / acoustic waves are pressure waves measured in Pa The amplitude of the wave is usually called the Sound Pressure Level (SPL) The human ear can detect SPL as low as 20 Pa (hearing threshold) The human ear can withstand SPL as high as 60Pa

E N D
Sound Levels Sound / acoustic waves are pressure waves measured in Pa The amplitude of the wave is usually called the Sound Pressure Level (SPL) The human ear can detect SPL as low as 20Pa (hearing threshold) The human ear can withstand SPL as high as 60Pa The human ear has a dynamic range of 60 / 20x10-6 = 3,000,000 The human ear perceives SPL (nearly) logarithmically: a 10-fold increase in sound power (or intensity) is needed for a human to perceive a doubling on loudness. The dB is based on the hearing threshold (20Pa) Because acoustic power (P) is proportional to acoustic pressure (p):
Sound Levels – Examples: The measured SPL in a room is 40Pa. What is the Sound level in dB? • The volume of a music player is increased by 10, what is the change in dB? • The volume of a music player is increased by 100, what is the change in dB? • At the launch of India’s Polar Satellite Launch Vehicle (PSLV) rocket, you measure the sound level at 170 dB. How much acoustic pressure is measured by your microphone?
Reverberation time – Example: A rich sound is produced in a room and suddenly stopped. Calculate the reverberation time from the recorded acoustic pressure shown below:
Reverberation time – Example: Remember: Reverberation time = time taken for sound to decrease by 60 dB
Reverberation time – Example: Step 1: Compute moving RMS (Root-Mean-Square) Note: Must select window width (in seconds) Moving RMS [Pa] Recorded sound [Pa]
Reverberation time – Example: Step 2: Transform moving RMS into dB and plot Moving RMS [Pa] Recorded sound [Pa] Moving RMS [dB]
Reverberation time – Example: Step 3: Zoom in dB vs time curve if necessary Moving RMS [Pa] Recorded sound [Pa] Moving RMS [dB]
Reverberation time – Example: Step 4: Select range (domain) for analysis Moving RMS [Pa] Recorded sound [Pa] • Selected • Range for • analysis
Reverberation time – Example: Step 5: Compute slope of dB vs time curve (straight line of best fit) Step 5: Compute Reverberation Tine (RT): RT=60/slope [s] Moving RMS [Pa] Recorded sound [Pa] Straight line of best fit: Slope [dB/s]
Reverberation Time – Example output from analysis software: Moving RMS [Pa] Recorded sound [Pa] Decay slope [dB/s] Moving RMS [dB]
Sound - Octaves • Partitioning the frequency scale is a long-standing practice based on music • The octave is base of doubling or halving the frequency • Smaller increments are used for musical instruments (eg: piano) such as 1/3 or 1/12 octave • The reverberation time of a room may vary depending on the frequency of the sound (dependent of the type of material that absorbs sound0 • Too much time / effort required to evaluate RT for small frequency bands (increments) over very large hearing range (20 – 20,000 Hz) • For practical purposes Octave Bands are used