Download
1 / 16
160 likes | 330 Views
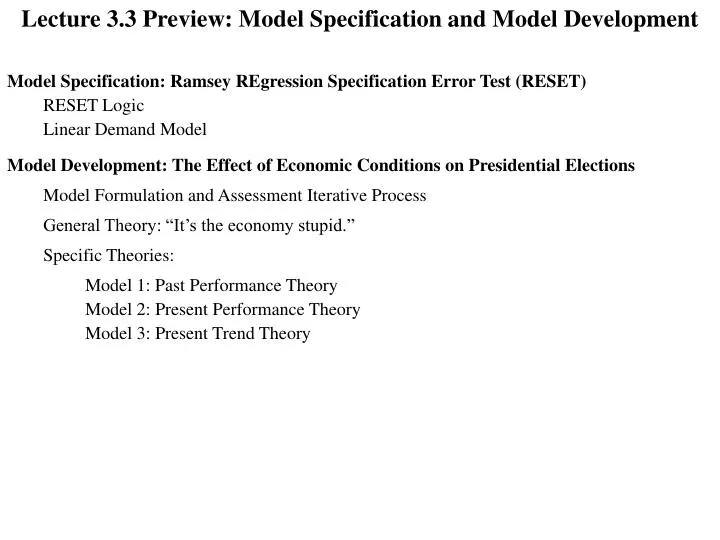
Lecture 3.3 Preview: Model Specification and Model Development . Model Specification: Ramsey REgression Specification Error Test (RESET). RESET Logic. Linear Demand Model. Model Development: The Effect of Economic Conditions on Presidential Elections.

E N D
Lecture 3.3 Preview: Model Specification and Model Development Model Specification: Ramsey REgression Specification Error Test (RESET) RESET Logic Linear Demand Model Model Development: The Effect of Economic Conditions on Presidential Elections Model Formulation and Assessment Iterative Process General Theory: “It’s the economy stupid.” Specific Theories: Model 1: Past Performance Theory Model 2: Present Performance Theory Model 3: Present Trend Theory
RESET: Ramsey REgression Specification Error Test RESET Question: Is the model using the available information in the “best” way? Original Model: yt = Const + xxt + et Artificial Model: Regression: bConst and bx estimate Const and x Why is this called an artificial model? Estimated or “fitted” values of y: Esty = bConst+ bxx By itself, it has no standing. Critical Point Since Esty is derived solely from the information used to estimate the original model, the artificial model includes no new information. The artificial model just uses the same information albeit in a different form. Consider the following null and alternative hypotheses: H0: Esty2 = 0 New form of the information adds NO explanatory power H1: Esty2 0 New form of the information adds explanatory power Prob[Results IF H0 True] small Prob[Results IF H0 True] large Unlikely H0 is true Likely H0 is true Unlikely that the new form of the information adds NO explanatory power PRS 1 Likely that the new form of the information adds NO explanatory power Likely that the new form of the information adds explanatory power PRS 2 Might it be prudent to consider a new model? Is there a compelling reason to consider a new model? Yes No
Linear Demand Model Original Model: Qt = Const + PPt + IIt + CPChickPt+ et EViewsLink Estimated Equation: EstQ = 159,032 549.5P + 24.25I + 287.4ChickP Artificial Model: H0: EstQ2 = 0 New form of the information adds NO explanatory power H1: EstQ2 0 New form of the information adds explanatory power Generate the variables: EstQ EstQSquared = EstQEstQ EViewsLink Critical Regression Result: The EstQSquared coefficient estimate is 5.79E-05, .0000579. The estimate does not equal 0; the estimate is .0000579 from 0. This evidence suggests that the new form of the information adds explanatory power.
H0: EstQ2 = 0 New form of the information adds NO explanatory power H1: EstQ2 0 New form of the information adds explanatory power Prob[Results IF H0 True]: What is the probability that the estimate of EstQ2 from one regression would be at least .0000579 from 0, if H0 were true (that is, if EstQ2 actually equaled 0, if the different form of the information added no explanatory power)? What does Prob[Results IF H0 True] equal? Prob[Results IF H0 True] = .0276 Question: At the “traditional” significance levels of 5 or 10 percent (.05 or .10) : Prob[Results IF H0 True] small Unlikely H0 is true t-distribution Unlikely that the new form of the information adds NO explanatory power .0276/2 .0276/2 Likely that the new form of the information adds explanatory power bEstQ2 .0000579 .0000579 0 .0000579 Might it be prudent to consider a new model that uses the information in a different form? Yes
Let us see how EViews can do the work for us. Artificial Model: H0: EstQ2 = 0 New form of the information adds NO explanatory power H1: EstQ2 0 New form of the information adds explanatory power EViewsLink Run the original regression; Click View, Stability Diagnostics, Ramsey RESET Test; Enter the number of artificial variables to include (1 by default); Click OK. Estimate of EstQ2 = .0000579 These are the same results as before. Prob[Results IF H0 True] = .0276 EViews is automatically doing what we did “by hand.” EViews is also automatically performing a Wald test. As we saw before, the two-tailed t-test and the Wald test are equivalent. Summary: At the “traditional” 5 percent (.05) significance level, we reject H0. Reject the notion that the new form of the information adds no explanatory power.
Model Development: Model Formulation and Assessment – An Iterative Process Keep in mind two important points: There is no “cookbook” procedure we can follow. Common sense and inventiveness play critical roles in model development. Model Formulation: Formulate a specific model describing the general theory. Incorporate insights from the assessment to refine the specific model describing the general theory. Model Assessment: Apply econometric techniques to assess the specific model Art and science.
1992 Election: Bill Clinton versus George Bush (George W.’s father) Clinton’s Mantra: “It’s the economy stupid.” General Theory: The American electorate is sensitive to economic conditions; Americans hold the President and his party responsible for the state of the economy. Good economic conditions increase the vote for the President’s party; Bad economic conditions decrease the vote for the President’s party. Question: How can we test that theory? Data: 1890 to 2008 VotePartyDemtPercent of popular vote received by the Democratic candidate in year t VotePartyReptPercent of popular vote received by the Republican candidate in year t VotePartyThirdtPercent of the popular vote received by third party candidates in year t PresPartyRept1 if incumbent President is Republican in year t; 0 if Democrat PresIncumt1 if incumbent President is a candidate in year t, 0 otherwise PresPartyTermstNumber of consecutive terms the incumbent President’s party has held the Presidency in year t UnemCurrenttUnemployment rate in year t (percent) RealGdpCurrenttReal GNP in year t (percent) RealGdpGrowthtReal GNP growth rate in year t (percent) PriceCpiCurrenttPrice level in year t (CPI) InflCpiCurrenttInflation rate in year t based on the CPI (percent) PriceGdpCurrenttGDP price deflator in year t InflGdpCurrenttInflation rate in year t based on the GDP price deflator (percent)
Generate a New Variable VotePresPartyt Percent of popular vote received by the President’s party in year t PresPartyR1t Dummy variable: 1 if Republican incumbent, 0 if Democrat VotePresPartyt = PresPartyR1tVotePartyRept + (1PresPartyR1t)VotePartyDemt When President’s party is Rep: PresPartyR1t = 1 VotePresPartyt = VotePartyRept When President’s party is Dem: PresPartyR1t = 0 VotePresPartyt = VotePartyDemt Data Oddities EViewsLink Third Parties Year VotePartyDem VotePartyRep VotePartyThird1912 41.8 23.2 35.0 1924 28.5 54.0 17.5 1968 42.7 43.4 13.9 1992 43.3 37.7 19.0 1912 President Election: Third parties garnered more than a third of the vote. How might we account for 1912 and the other “odd” years? Two of many possibilities: Ignore 1912 (and perhaps the other unusal elections also). VotePresPartyTwot Percent of popular vote received by the President’s party based on the two major parties (ignoring third parties) VotePresPartyt 100 VotePresPartyTwot = VotePresRept + VotePartyDemt
Voting Models Voting Model 1: Past Performance – The electorate is sensitive to how well the economy has performed in the three years prior to the election. UnemPriorAvgt Average unemployment rate in the three years prior to election UnemCurrentt (1) + UnemCurrentt (2) + UnemCurrentt (3) UnemPriorAvgt = 3 Step 0: Construct a model reflecting the theory to be tested Model:VotePresPartyTwot = Const+ UnemPriorAvgUnemPriorAvgt + et Theory:UnemPriorAvg < 0 PRS 3 Step 1: Collect data, run the regression, and interpret the estimates. EViewsLink PRS 4 Interpretation: We estimate that a 1 percentage point increase in the average unemployment rate during the three years prior to the election increases the vote the President’s party receives by .33 percentage points. Critical Result: The coefficient estimate for UnemPriorAvg equals .33. The positive sign of the coefficient estimate suggests that an increase in the average unemployment rate in the three years prior to the election increases the votes received by the President’s party. Bad news. What should we do? Back to the “drawing board.” Is this good or bad news?
Model Development: Model Formulation and Assessment – An Iterative Process Model Formulation: Formulate a specific model describing the general theory. Incorporate insights from the assessment to refine the specific model describing the general theory. Model Assessment: Apply econometric techniques to assess the specific model
Voting Model 2: Present Performance – The electorate is sensitive to how well the economy is performing during the election year. Step 0: Construct a model reflecting the theory to be tested Model:VotePresPartyTwot = Const+ UnemCurrentUnemCurrentt + et Theory:UnemCurrent < 0 EViewsLink Step 1: Collect data, run the regression, and interpret the estimates. PRS 5 Interpretation: We estimate that a 1 percentage point increase in the election year unemployment rate decreases the vote the President’s party receives by .12 percentage points. Critical Result: The coefficient estimate for UnemCurrent equals .12. The negative sign of the coefficient estimate suggests that a higher unemployment rate in the election year decreases the votes received by the President’s party. Is this good or bad news? Good news. Step 2: Play the cynic and challenge the results; construct the null and alternative hypotheses Cynic’s View: Despite the results the current unemployment rate has no effect on votes for the President’s party. H0: UnemCurrent = 0 UnemCurrent has no effect on VotePresPartyTwo H1: UnemCurrent < 0 Higher UnemCurrent reduces VotePresPartyTwo
Step 3: Formulate the question to assess the cynic’s view: Prob[Results IF H0 True] Hypotheses: H0: UnemCurrent = 0 H1: UnemCurrent < 0 Generic Question: What is the probability that the results would be like those we actually obtained (or even stronger), if the cynic were correct? Prob[Results IF H0 True] Specific Question: The regression’s coefficient estimate was .12: What is the probability that the coefficient estimate in one regression would be .12 or less, if H0 were actually true (if the actual coefficient, UnemCurrent, equaled 0)? bUnemCurrent .12 0 Step 4: Calculate Prob[Results IF H0 True]. .6746 Prob[Results IF H0 True] = .34 About 1 chance in 3. 2 Step 5: Decide on the standard of proof, a significance level. At the “traditional” significance levels of 1, 5, or 10 percent (.01, .05, or .10) would you reject H0? No. Is this good or bad news? Bad news.
Model Development: Model Formulation and Assessment – An Iterative Process Model Formulation: Formulate a specific model describing the general theory. Incorporate insights from the assessment to refine the specific model describing the general theory. Model Assessment: Apply econometric techniques to assess the specific model
Voting Model 3: Trend – Electorate is sensitive to the economic trend; more specifically, whether the unemployment rate is rising for falling during the election year. Step 0: UnemTrendt Change in unemployment rate from the prior year UnemTrendt = UnemtUnemt (1) Model:VotePresPartyTwot = Const+ UnemTrendUnemTrendt + et Theory:UnemTrend < 0 Step 1: EViewsLink Interpretation: We estimate that a 1 percentage point rise in the unemployment from the previous year decreases the vote the President’s party receives by .75 percentage points. Critical Result: The UnemTrend coefficient estimate equals .75. The negative sign of the coefficient estimate suggests that deteriorating economic conditions as evidenced by a rising unemployment decreases the vote received by the President’s party. Is this good or bad news? Good news. H0: UnemTrend = 0 UnemTrend has no effect on VotePresPartyTwo Step 2: H1: UnemTrend < 0 Rising unemployment reduces VotePresPartyTwo Steps 3, 4, and 5: .1965 Prob[Results IF H0 True] = .10 2 We are getting closer to the “traditional” significance levels?
Model Development: Model Formulation and Assessment – An Iterative Process Model Formulation: Formulate a specific model describing the general theory. Incorporate insights from the assessment to refine the specific model describing the general theory. Model Assessment: Apply econometric techniques to assess the specific model
Voting Model 4: Trend –The electorate is sensitive not only to the unemployment rate trend, but also the trend in prices, the inflation rate during the election year. Step 0: UnemTrend Change in unemployment rate from the prior year InflCpiCurrent Inflation rate in election year based on the CPI Model:VotePresPartyTwot = Const+ UnemTrendUnemTrendt + InflCpiCurrentInflCpiCurrentt + et Theory: Unemployment: UnemTrend < 0 Inflation: InflCpi < 0 Step 1: EViewsLink UnemTrend Coef = 1,036: Rising unemployment leads to fewer votes for Pres’s party InflCpiCurrent Coef = .5743: Rising prices lead to fewer votes for Pres’s party Steps 2, 3, 4, and 5: Inflation Unemployment Trend H0: UnemTrend = 0 UnemTrend has no effect H0: InflCpiCurrent = 0 InflCpi has no effect H1: UnemTrend < 0 Rising unemployment reduces Pres’s votes H1: InflCpiCurrent < 0 Rising prices reduces Pres’s votes .0675 .0508 Prob[Results IF H0 True] = .034 Prob[Results IF H0 True] = .025 2 2 In each case, would you reject the null hypothesis at the “traditional” significance levels?